Evaluating
Automated Power Distribution Systems
Using
Computer Simulations
Hesham
E. Shaalan, Ph.D.
Engineering
Technology Program
Texas
A&M University-Corpus Christi
Email:
hshaalan@falcon.tamucc.edu
ABSTRACT
Electric utilities are frequently
faced with the need to spend millions of dollars on distribution system expansion.
Distribution automation provides a tool to achieve maximum utilization of the
utility's physical plant, and to provide high quality of service to its customers.
The challenge is to identify and evaluate potential automation functions and
determine those appropriate for implementation. It is also important to examine
potential costs and benefits of distribution automation. A computer-aided approach
simulates distribution automation functions before actually implementing them,
saving substantial amounts of time and money. A software package developed for
the Electric Power Research Institute is used to perform the simulations. This
paper presents the cost-benefit analysis of a distribution automation plan based
on modeling a section of a Georgia Power Company service area. The analysis
will provide potential economic benefits along with improved efficiency due
to the implementation of distribution automation.
INTRODUCTION
Power distribution represents
the final link between the total electric power supply system and the customer.
Thus, over the next decade, millions of dollars will be spent in
distribution system expansion. Automating the power distribution system can make
the overall system operate more efficiently. Increased efficiency on the
distribution level improves the use of existing facilities on the distribution,
transmission, and generation levels. Thus, distribution automation provides a
tool to achieve maximum utilization of an electric utility's physical plant and
to provide the highest quality of service to its customers. Clearly, both the
utility and its customers can benefit from successful distribution automation
projects1.
The technology required to
implement distribution automation is available today.
Many devices are now available that can automate system functions such as
automatic switching. The challenge is to identify and evaluate potential
automation functions and determine those appropriate for implementation. It is
therefore important to examine potential costs and benefits of distribution
automation1. Moreover, the economic aspects are becoming more
important due to the recent
deregulation
of the power industry, which introduced more competition. Therefore,
distribution automation provides a competitive edge to the utilities that
implement it.
The application of distribution
automation can increase asset utilization, lower operating costs, and reduce
outage times. However, all projects must be evaluated based on tangible savings
and costs, which are not easy to quantify. In some cases, utilities have not
been able to perform studies that can provide accurate and dependable results.
A computer-aided approach can
be used to simulate distribution automation functions before actually implementing
them, saving a substantial amount of time and money. A software package developed
for the Electric Power Research Institute (EPRI) can be used to perform such
simulations2. There are other commercially available software packages
that can also perform similar analyses such as the software from PowerWorld
(www.powerworld.com),
EDSA (www.edsa.com),
and ASPEN (www.aspeninc.com). This paper presents the cost-benefit analysis of a distribution
automation plan based on modeling a section of a Georgia Power Company service
area. The analysis will examine potential costs and benefits of specific automation
functions. The economic benefits to Georgia Power Company will be calculated
along with improved performance measures such as system efficiency.
DEWORKSTATION DESCRIPTION
The Electric Power Research
Institute Distribution Engineering Workstation (DEWorkstation) provides a
computer aided engineering workstation environment to perform design and
operational studies for distribution systems. DEWorkstation is conceptually
divided into four major parts: a relational database, Graphical User Interface
(GUI), an Application Programmer Interface (API), and applications used for
analysis, design and operational studies. DEWorkstation has also been designed
to provide users with a platform suitable for distribution automation
evaluations.
The
GUI interface incorporates data from the database into distribution system
models. Substations and circuits can be entirely built and edited with mouse
and/or keystroke operations. Once a distribution system model has been created
with the GUI, any application module may be used for engineering studies.
DEWorkstation
is designed to meet the analysis, planning, design and operation needs of
distribution engineering through its available application modules. These
modules perform, among others, the following types of analyses: power flow, line
impedance calculation, economic analysis, distribution transformer sizing, and
cable pulling analysis.
The
open architecture framework of DEWorkstation supports future expansion. This
architecture allows for applications to request data or results from other
applications and for users to easily add, delete, or replace applications3.
Figure 1 shows the main screen of the workstation’s graphical user interface.
The system shown in the figure represents the section of a Georgia Power Company
service area that is being modeled. The dashed lines represent line segments of
various lengths. The symbol at the source represents a distribution substation
with two circuits starting at that point. The other symbols represent manual
switches or sectionalizing devices.
DEWorkstation
was previously used in an undergraduate course on power distribution systems
at Georgia Southern University. Several assignments were utilized to give students
a chance to perform distribution system analysis and design studies4.
Realistic examples such as the one presented here were used to illustrate to
students the practical application of DEWorkstation5.
DISTRIBUTION AUTOMATION
Electric
utilities are constantly seeking ways to reduce costs and improve system
performance. Recently, the availability of distribution automation equipment has
given utilities more choices in the design of distribution systems. Therefore,
distribution automation is now an important consideration in upgrading existing
systems and designing new ones. Economic evaluation of distribution automation
is also important since it facilitates the examination of associated costs and
benefits.
Automation can be thought of as doing
a repetitive task with minimal human intervention6. Distribution
automation refers to automation of repetitive tasks on the distribution system.
Automated switching techniques can be used to enhance the capabilities of a
power distribution system. An automatic switch can be defined as a switching
device that opens and closes to connect two or more sections of a power distribution
system, with the aid of computer control by remote communications. However,
manual switches are commonly used in present power distribution systems.
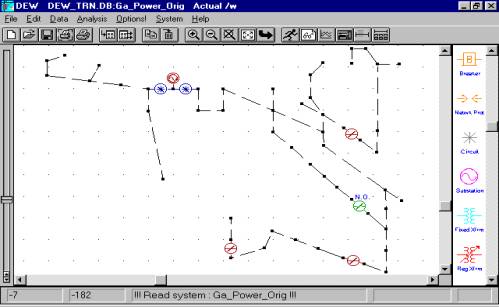 |
Figure 1. DEWorkstation Screen Showing Existing System
The
idea behind automatic switching is that when load peaks change in different
areas of the system, the switch opens or closes to direct power to the location
where it is needed. This is an important factor due to the time varying nature
of different load types, or load diversity. Automatic switching can also be
performed as frequently as needed in contrast with manual switching.
Furthermore, an automatic switch can quickly isolate faulted sections of the
network to minimize power interruption. The time required for these switching
operations is reduced to a few minutes due to computer control and remote
communications. By contrast, manual switches require a minimum of one to two
man-hours. By replacing manual switches with the automated type, power flow can
be altered much faster and cheaper.
ECONOMIC
ANALYSIS
Electric
utilities are frequently faced with the need to make informed decisions
regarding alternatives involving money. These alternatives may involve the
implementation of a distribution automation function or the replacement of old
equipment. The problem is made more complex because expenditures associated with
a given project may occur at different times in the life of the project. An
economic equivalence function, such as present worth, provides a common economic
evaluation measure.
Money
has a time value since both inflation and interest rates determine the value of
an amount at given points in time. In a present worth analysis, monetary amounts
occurring at different times in the future are reflected to the present time. By
doing so, competing alternatives may be placed on equal footing, and the
appropriate economic choices can be made. The present worth of total annual
costs will be determined for the modeled section of the Georgia Power network
based on a 5% interest rate.
The
two main factors being considered here when comparing alternatives are
efficiency and total annual cost. Efficiency is evaluated in the form of kWh
line losses. One way to reduce distribution system losses is to change the way
the system serves the load by reconfiguring the switches. Switching will
distribute loads in a better way that will reduce the distribution system line
losses7. Reference 7 provides more information on the algorithm used
by DEWorkstation.
The
costs associated with an alternative can be expressed as capital cost and
operating expense. The capital cost is associated with the initial placement of
equipment including purchase price and installation cost. The operating expense
is associated with the ongoing operation of equipment. The yearly cost
associated with capital cost is referred to as a carrying charge8.
The carrying charge factor is used to reduce capital costs to a yearly amount,
and it is assumed here to be 20%. Thus, the total annual cost is the sum of
carrying charges and operating expenses.
The
operating expenses consist of maintenance cost and the cost of losses. The
maintenance cost is based on the scheduled maintenance of all equipment as well
as the labor cost. The cost of losses is based on the total system kWh losses
multiplied by the generation cost of $0.05/kWh.
EVALUATION RESULTS
The
modeled section of the Georgia Power network represents an existing system that
contains only manual switches for power flow control as shown in Figure 1. The
switch designated by “N.O.” indicates its normally open status, while the
other three switches are normally closed. Several types of loads exist on the
network such as residential, commercial, and industrial loads. An annual load
growth factor of 1% is used based on the historical data and future predictions.
Additional information is not provided in this paper due to the confidentiality
of the data.
The
automated system is assumed to have two automatic switches installed in addition
to the existing four manual switches as shown in Figure 2. The two automatic
switches are designated by “S1” and “S2” in Figure 2. The capital cost
of the two automatic switches is estimated to be $32,000. The capital cost
includes all necessary equipment such as remote terminal units and communication
equipment8.
The
advantage of using automated switching is that switches open or close, directing
power to where it is needed in response to peak load changes throughout the
system. In addition, automatic switches can be operated as frequently as needed
in contrast with manual switches. Consequently, reconfiguring the system to
deliver power more efficiently can reduce line losses.
The
two alternative systems are designated here as the “Original” and the
“Automated” system. The following results were obtained for both systems
based on the analysis performed by DEWorkstation software.
All existing equipment in the original system is assumed to be paid for since it has been installed for more than ten years. In other words, there are no carrying charges associated with the original system. The automated system has carrying charges associated with the capital cost of the automatic switches. The carrying charge factor is assumed to be 20%, which means the capital cost is approximately divided over five years. Therefore, the analysis period for both systems is five years.
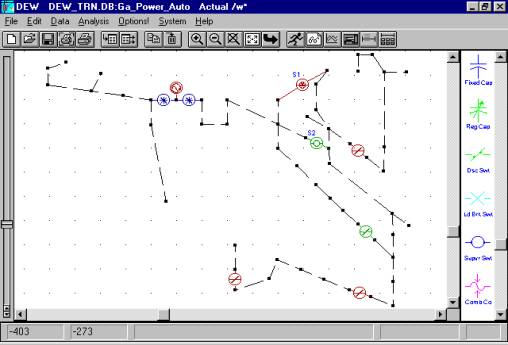 |
Figure
2. DEWorkstation Screen Showing Automated System
Table
1 shows the total annual kWh losses for both systems over five years. It should
be noted that these losses represent the analysis time periods of 24 hours a
day for 365 days. Comparing the results of the two systems indicates that the
automated system can provide a 7.8% reduction in losses every year. Figure 3
shows plots of annual losses for both systems, which illustrate the difference
between them. The cost of these loses over five years is shown in Table 2 for
both systems.
The
total cost for the original system as well as the automated system is shown
in Table 3. The components of the total cost for the original system are cost
of losses and maintenance cost. The automated system has the additional component
of carrying charges. Comparing these results indicates that the automated system
can reduce total costs by 5.4% in the first year, with similar reductions in
subsequent years. Figure 4 shows plots of total annual costs for both systems,
illustrating the difference between them. The present value of total annual
costs over five years is $1,342,690 for the original system and $1,271,721 for
the automated system, which represents a saving of $70,969.
Year |
Original System |
Automated
System |
Automated
System Reduction |
|
1 |
5,856,097 |
5,400,820 |
455,277 |
|
2 |
5,973,549 |
5,509,120 |
464,429 |
|
3 |
6,093,361 |
5,619,598 |
473,763 |
|
4 |
6,215,582 |
5,732,296 |
483,286 |
|
5 |
6,340,259 |
5,847,259 |
493,000 |
Year |
Original
System ($) |
Automated
System ($) |
Automated
System Savings ($) |
|
1 |
292,805 |
270,041 |
22,764 |
|
2 |
298,677 |
275,456 |
23,221 |
|
3 |
304,668 |
280,980 |
23,688 |
|
4 |
310,779 |
286,615 |
24,164 |
|
5 |
317,013 |
292,363 |
24,650 |
Table 3. Total Cost for Original and Automated Systems
Year |
Original
System ($) |
Automated
System ($) |
Automated
System Savings ($) |
|
1 |
298,405 |
282,249 |
16,156 |
|
2 |
304,445 |
288,158 |
16,287 |
|
3 |
310,609 |
294,197 |
16,412 |
|
4 |
316,898 |
300,370 |
16,528 |
|
5 |
323,315 |
306,679 |
16,636 |
|
|
Figure 3. Total annual losses for original and automated systems
CONCLUSION
Distribution automation is becoming an important consideration in upgrading existing systems and designing new ones. Economic evaluation of distribution automation is essential since it provides a good measure of potential costs and benefits. The results obtained in this paper are based on a modeled section of the Georgia Power Company network, which represents an existing system. The results were based on modeling the system using DEWorkstation software.
The results show that using automated switching improved system efficiency by lowering line losses. Furthermore, the total costs associated with the automated system were lower than the original system. This is because the additional carrying charges associated with automatic switches were still lower than the additional cost of losses associated with the original system. Accordingly, distribution automation can provide economic benefits as well as improved system performance.
ACKNOWLEDGEMENT
The author gratefully acknowledges the help of Georgia Power Company for providing the data.
REFERENCES
1.
R. Broadwater, H. Shaalan, W. Fabrycky, and R. Lee, “Decision Evaluation
With Interval Mathematics: A Power Distribution System Case Study,” IEEE Transactions
on Power Delivery, Volume 9, Number 1, January, 1994, pp. 59-67.
2.
H. Shaalan, J. Thompson, R. Broadwater, M. Ellis, and H. Ng, “Distribution
Engineering Tool Features a Flexible Framework,” IEEE Computer Applications
in Power, Volume 8, Number 3, July 1995, pp. 21-24.
3. H. Shaalan, J. Thompson, R. Broadwater, H. Ng, “DEWorkstation: A Comprehensive Distribution Modeling Tool,” Proceedings of the 1996 IEEE/PES Transmission and Distribution Conference, Los Angeles, CA, September 15-20, 1996, pp. 7-12.
4.
H. Shaalan, “Using Engineering Software to Teach Electric Power Distribution,”
The Technology Interface, Volume 3, Number 2, Spring 1999.
5.
H. Shaalan, "Using Simulations of Actual Power Distribution Systems
as an Educational Tool," Proceedings of the 2002 North American Power Symposium,
Tempe, AZ, October 14-15, 2002, pp.
516-518.
6.
Distribution Automation: IEEE Tutorial Course Number 88EH0280-8-PWR,
Piscataway, NJ, 1988.
7.
R. Broadwater, A. Khan, H. Shaalan, and R. Lee, “Time Varying Load Analysis
To Reduce Distribution Losses Through Reconfiguration,” IEEE Transactions on
Power Delivery, Volume 8, Number 1, January, 1993, pp. 294-300.
8.
H. Shaalan and R. Broadwater,
“Using Interval Mathematics in Cost-Benefit Analysis of
Distribution Automation,” Electric Power Systems Research Journal, Volume
27, Number 2, 1993, pp. 145-152.