
Using
Theory of Constraints
To
Improve Electronics Assembly Process Throughput
Reza
A Maleki, Ph.D., P.E., C.Mfg.E
Department of Industrial and Manufacturing Engineering, North Dakota State University
Email: Reza.Maleki@ndsu.nodak.edu
Qing
Gu, Ph.D. Research Assistant
Department of Industrial and Manufacturing Engineering, North Dakota State University
Email: Qing.Gu@ndsu.nodak.edu
Jim
Springer
Phoenix International
Email:
jspringe@phoeintl.com
ABSTRACT
Stencil printing, pick-and-place, reflow, and wave soldering are typical processes used in the assembly of printed circuit board components. A brief overview of each process will be given in this article. The Theory of Constraints methodology will be used to discuss some of the possible methods to improve the throughput of printed circuit board assembly processes.
INTRODUCTION
A typical electronic assembly flow chart is shown in Figure 1. To simplify the discussion, a wave soldering process will not be included. This can be the case when all of the components are surface mount components or when only a few of the components are through-hole 4. Therefore, the focus of this article will be on stencil printing, pick-and-place, and reflow processes. Using Theory of Constraints methodology, the processes will be analyzed to improve the overall throughput of the aforementioned processes.
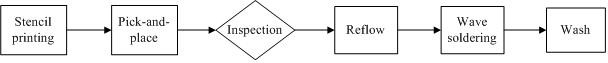
Figure 1. Typical Electronic Assembly Flow Chart
ELECTRONICS
ASSEMBLY PROCESS DESCRIPTIONS
Stencil Printing
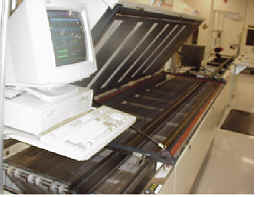
Stencil printing is the process where, using a squeegee, a solder paste is applied on the designed pads of a printed circuit board (PCB) substrate. In a subsequent process, components will be placed and attached on the pads and then will be reflowed 5. A commercially available stencil printer is shown in Figure 2. Figure 3 shows a close view of stencil and squeegees.
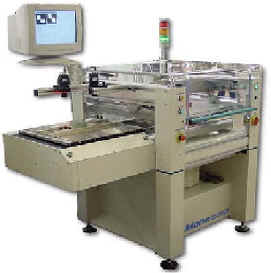
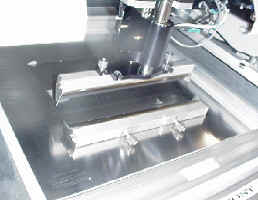
Figure 3. Close view of Stencil and Squeegees
Picture courtesy of Phoenix
International
Three
parameters are of utmost importance in the stencil printing process:
·
squeegee pressure
·
squeegee speed, and
·
stencil separation speed.
Temperature
and humidity are also critical process parameters, but they will not be
addressed in this paper because they are paste type dependent.
Squeegee Pressure - High pressure setting is likely to lead to lower paste heights because of the tendency of the rubber squeegee to “scoop” out pastes from the filled apertures as it traverses over the stencil. Because of the smaller aperture size, this scooping effect is not an issue in the flip chip stencil design. The key issues are that of filling and emptying of the very small apertures, and hence the main defect will be skipping. Skipping increases as the ratio of aperture width to particle size decreases. The tendency for particles to jam against each other increases. This is the reason for the recommended pressure setting of 6 kg. This pressure setting provides good paste deposit height 9.
Squeegee Speed – In the stencil printing, according to the literature cited 9, it is suggested that speeds in the range of 5 to 12.5mm/sec produce satisfactory results. Slower speed allows more time for both aperture filling and for the squeegee to compact the paste into the aperture. Higher speed is not preferred for fine pitch application because there is little time for the solder paste to fill the aperture. A speed of 10mm/sec. is recommended. This speed provides very good paste deposit heights.
Stencil Separation (snap off) Speed – This is the speed at which the PCB loses contact with the stencil. This parameter is sharply associated with the skipping defect. For flip chip geometries with very small aperture sizes, the effect of varying the stencil substrate separation speed on skipping has been studied, and the results found that skipping is mostly due to the breaking-off of the paste inside the aperture as the stencil and substrate separate. This study suggests that stencil substrate separation speed of less than 3 mm/sec minimizes skipping and reduces variations 9. Many screen printers have the separation speed as a parameter that can be set. Most of the stencil printer equipment manufacturers set the first 3mm snap off speed to 1mm/second and then speed to maximum withdraws to the home position after the PCB clears the stencil. See reference [9] for additional information related to stencil printing setup.
Pick-and-Place Equipment
Pick-and-place machines are high precision equipment that place components reliably and accurately on the PCB boards that have been stencil printed. Generally there are three types of pick-and-place machines which include high throughput, high flexibility, and their combination, high throughput/high flexibility.
High throughput, generally, is associated with less flexibility. High throughput machines are typically suitable for placing passive components such as resistors and capacitors.
In comparison, equipment with high flexibility has lower throughput. These types of equipment are of the sequential type in which components are placed one at a time. The equipment can place almost all types of components, from a chip to a large PLCC (Plastic Leaded Chip Carrier), including fine pitch and BGAs (Ball Grid Array). See Figure 5. These types of equipments’ throughput depend upon the type of components being placed and are relatively low.
When both speed and flexibility are desired, an option is
to combine two complementary machines in a PCB assembly - one with high
throughput and the other with high flexibility.
Both pick-and-place types of equipment are essentially similar except
that, usually, the flexible pick-and-place equipment is fitted with a vision
system. One machine is used for
smaller components while the other machine is used for larger and fine pitch and
BGA components 6.
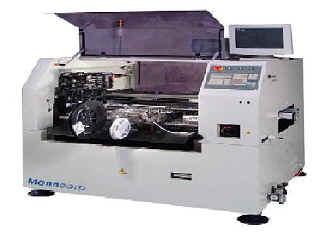
Figure 4. Pick-and-Place
Machine
Figure
6. Reflow Oven
Picture
courtesy of Phoenix International
Heating Stage - A
linear ramp rate of 0.5°-1°C/second allows gradual evaporation of volatile
flux constituents and prevents defects such as solder balling/beading and
bridging as a result of hot slump. It
also prevents unnecessary depletion of fluxing capacity when using higher
temperature alloys 8.
Liquidus Stage – As shown in Figure 7, a peak temperature of 25° - 45°C above the melting point 183°C of the solder alloy is needed to form a quality solder joint and achieve acceptable wetting due to the formation of an inter-metallic layer. If the peak temperature is excessive, or the time above liquidus greater than the recommended 45-90 seconds, flux charring, excessive inter-metallic formation and damage to the board and components can occur.
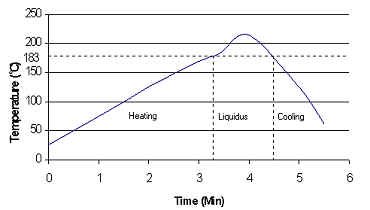
Figure 7. Recommended Profile for Sn37Pb 8
Cooling Stage - The cooling rate of the solder joint after reflow is also important. The faster the cooling rate, the smaller the grain size of the solder and hence the higher the fatigue resistance of the solder joint. So the cooling rate should be as fast as possible. A cooling rate of 10°C/sec can be easily achieved in most ovens.
THEORY
OF CONSTRAINTS
The Theory of Constraints (TOC) was developed and popularized by Eliyahu Goldratt. Goldratt’s initial work describing the TOC was published in his book, The Goal 2. TOC is an innovative management philosophy that encourages a shift in focus from local efficiencies to the critical chain of events required to complete a project.
In “The Goal”, the theory is well described by directing readers to find and support the main limiting factor that inhibits an organization achieving its goal. The goal could be many things including improving system throughput. In describing the theory, Goldratt refers to these limiting factors as “constraints.” A constraint can be physical or non-physical. A physical constraint is something like the physical capacity of a machine. Examples of non-physical constraints might include demand for a product and a corporate policy.
To manage constraints, Goldratt has developed and proposes a five-step process of on-going improvements. The five steps for managing constraints are the following:
1. Identify the system’s constraint(s). What are the main bottlenecks?
2. Decide how to exploit the system’s constraint(s). Recognizing that a system’s constraints dictate the throughput--the rate at which the system generates money through sales--do everything you can to get the most out of the constraint.
3. Subordinate everything else to the decision made in step 2. Support the constraint by finding different and better ways for the constraint to work and remove tasks it does not need to do.
4. Elevate the system’s constraint(s). After having made the best possible use of the constraint(s), the next step is to reduce the constraints’ limitations on the system performance.
5. If a constraint is broken, go back to step 1.
Most individuals who have read “The Goal” can readily see the use for the Theory of Constraints in the improvement of production scheduling or in improving manufacturing. While the TOC as described in “The Goal” provides the readers with a simple example in the manufacturing environment, the applications of the TOC extend to any process in any organization.
The remainder of this paper will discuss the possible methods to improve the throughput of printed circuit board assembly processes using the TOC methodology.
Step
1. Identify the
system’s constraint(s).
Identify the process bottleneck(s).
Stencil Printing
It should be kept in mind that once the machine is set up, the stencil printer will almost never be a bottleneck in an SMT manufacturing line. Throughput for a printer is a function of squeegee travel speed and board size.
Since
the squeegee travels at about 0.5 to 4 inches per second, a board can be printed
almost every 20-30 seconds. Compare this throughput to 0.5 to 4 seconds per
component during placement. This
means that virtually no pick-and-place equipment available can keep up with a
stencil printer unless there are very few components on the board.
Therefore, unless the manufacturing line is totally automated, there is
no need to go overboard on functions that increase the throughput of the screen
printer.
Pick-and-Place
As was mentioned before, depending on the needs, the user may choose different pick-and-place equipment, either high throughput or high flexibility, or a combination of both. Capital investment will be one of the major factors to consider when selecting the equipment. Typically, surface mount pick-and-place equipment, including a full complement of feeders, constitutes about 50% of the total capital investment required for a medium volume surface mount manufacturing line. As suggested in reference [7], as a general guide, the rated placement rate quoted by the pick-and-place equipment vendor should be reduced by 40-50% to arrive at a conservative number.
As an example, let’s consider a machine with a placement rate of 4000 components per hour. Then according to the before-mentioned general guide, the estimated placement rate will be at 2000 components per hour. It is obvious that the time needed to place a board will be proportional to the number of components on the PCB board. Assuming that there are four kinds of boards with a different number of components on one side, then the approximate time needed to place the components can be estimated and is shown in Table 1.
Table
1. Relationship Between Number of Components
and Placement Time Here the average
placement rate is used to simplify the discussion.
|
Board No. |
Number of Components on one side |
Placement Rate (per min) |
Total Time needed (min) |
|
1 |
20 |
34 |
0.6 |
|
2 |
40 |
34 |
1.2 |
|
3 |
80 |
34 |
2.4 |
|
4 |
120 |
34 |
3.6 |
Reflow Soldering
As can be observed from the reflow profile shown in Figure 6, the time needed to finish the reflow process is about 5.5~6.0 minutes. The reflow profile may vary from different solder pastes, but the changes of reflow time are very minimal. For the purpose of this paper, the Sn37Pb solder paste reflow profile is used as the guideline. Given that the reflow profile is well developed, it is unlikely that the reflow time period can be shortened to improve the throughput.
Bottleneck Identification
From the above analysis, it can be concluded that the bottleneck can change between the reflow and pick-and-place process. The capacity of pick-and-place equipment depends on the number of components being assembled, and the capacity of the reflow process is a function of the reflow profile of the solder paste being used.
Step 2. Decide
how to exploit the system’s constraint(s).
Go through the process of improving the Bottleneck Throughput.
Step 3. Subordinate
everything else to the decision made in step 2.
Steps 2 and 3 are discussed simultaneously since, depending on the characteristics of PCB and the number of PCBs processed simultaneously, the system’s bottlenecks might shift back-and-forth between reflow and pick-and-place equipment. Subsequently, this shifting affects the way the decisions are made to provide support for the bottleneck.
Since it is the bottleneck that dictates the rate of the output, it is imperative to make the best use of its available capacity (exploiting the system’s constraint). This can be achieved by making a predetermined schedule for the product mix that yields the optimal throughput. A logistical system must be put in place to keep the bottleneck from starving or from being blocked. This may require synchronization not only among the equipment but also among the entire supply chain providing all the necessary components and consumables to the bottleneck when needed (subordination).
Reflow Process - The potential for increased throughput in a reflow process exists by processing more than one board at a time. In a convection dominant reflow system, it is possible to reflow multi-boards at one time, which means the average reflow time for one single board will decrease accordingly. Therefore, if five boards are processed at one time, then the reflow time for one board will be 5.5~6.0 minutes (see Figure 7) divided by 5, that is 1.1~1.2 minutes, which is roughly equal to the time to pick-and-place 40 components (see Table 1). The other parameter that must be considered is the loading effect on the reflow profile. An oven with one board may/may not respond differently when multiple boards are placed on the conveyor tunnel.
Controlling the Number of Components - It seems unreasonable to control the number of components on a board since a board must have designed components to perform certain functions. It is, however, possible and is a common practice in electronic assembly that several identical boards are processed together to improve the throughput, and after processing together they are separated into single boards. In such cases a decision must be made as to how many sub-boards can be processed at one time, therefore treating them as one single board. This provides the opportunity to better manage the number of components placed in a group of sub-boards and achieve a more optimal throughput corresponding with the entire assembly process.
Let’s consider a board consisting of 20 components on one side. In such case the pick-and-place machine will be faster than reflow soldering. For a pick-and-place machine, processing a set of two boards together means placing 40 components on one integrated board. Based on the discussion presented in the “Reflow Process” section, reflow processing of five sets of boards, where each set is made of two individual boards having 20 components, provides a better match with the time required for the pick-and-place operations.
Double-side Reflow – Previous sections have focused on such cases that all of the surface mount components are on one side of the PCB board. Practically, most of the boards are double-sided. Figure 8 shows the flow chart of a double-side reflow process.
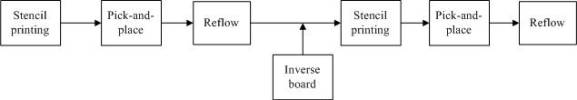
Figure 8. Double-side Reflow Flow Chart
Double-sided reflow is very common as boards get smaller. The same alloy and same reflow profile are used on both sides, as long as the surface tension of the solder is adequate to hold the components in place on the bottom of the board during the second side reflow. The major concern is the size of those components. They must not be so large that they fall off due to the lack of surface tension from the re-melted solder.
In the case of such double-sided reflow, if the reflow process has been the bottleneck for one side reflow, double-sided reflow will further deteriorate the situation. Reflowing both sides at one time can alleviate this concern.
Single step reflow can be achieved by using adhesive on one side. In a single-step soldering process, the surface mount components on the bottom side are placed on the solder paste and also glued in place with adhesive, which is dispensed after screening of the paste. Adhesive is needed because the tackiness of the paste alone will not hold components in place when the assembly is turned over, and the solder cannot hold components in place by surface tension unless it has had a chance to reflow. Surface mount components on the topside are held in place on the solder paste, and no adhesive is used.
When the assembly passes through the reflow system, both sides can be soldered simultaneously. The process steps will be stencil print the solder paste, dispense adhesive, place components, and cure/bake the adhesive/paste, invert the board and repeat the process, except for dispensing the adhesive. Figure.9 shows the process flow chart.
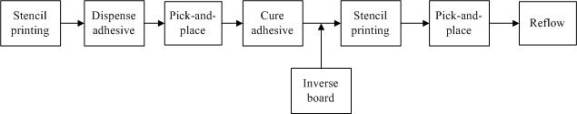
Figure 9. Single Step Double-sided Reflow Flow Chart
Using single-step double-sided reflow, time can also be saved by combining two soldering processes in one. However, while this is achieved, two more processes are added, adhesive dispensing and adhesive curing which add more time to the PCB assembly process. Since the dispenser will deposit a small amount of adhesive on each of the component locations on the under-side of the board, time spent on the adhesive dispenser is proportional to the number of components that need adhesive. If reducing the adhesive dispensing time is desired, then the side with fewer components on should be chosen as the bottom side. Time associated with adhesive curing is relatively short, which can be 1-3 minutes and depends on the adhesive material. Therefore, the user should compare the increased time resulting from adding the dispensing and curing of adhesive to the time saved as a result of combining two soldering processes together.
In terms of capital investment, the costs of equipment for dispensing and curing are relatively inexpensive. For improving the performance of the bottleneck, the focus should be on comparing the time saved by eliminating one reflow process versus the added time resulting from adding two adhesive related processes.
From the point of view of capital investment, the pick-and-place station will always be the bottleneck in electronic assembly, since it normally consumes more than half of the capital investment of the entire assembly line. Once the capacity of the pick-and-place equipment is decided, all of the other equipment has to subordinate to the pick-and-place equipment.
Goldratt summarizes the third step of the TOC in his training manual as follows:
“Release material into the plant according to the needs of the constraints allowing sufficient time for material to arrive.” The idea here is to make sure that the bottleneck is not starved by making available the consumables and components needed for production of PCB when they are needed and at the same time provide some level of protection against stock outs. Synchronization among various equipment in the system is also required to keep the bottleneck from starving.
Step 4. Elevate
the system’s constraint(s).
Goldratt summarizes the fourth step of the TOC as follows:
“After having made
the best possible use of the existing constraint(s), the next step is to reduce
its (their) limitations on the system performance.”
In many cases it is possible to elevate the system’s constraint. Some proven examples of ways of improving the performance of a system’s constraint include, but are not limited to
· improved equipment setup through implementation of setup reduction techniques,
· increased equipment speed and output through improving electronics and mechanical features,
· improved software, and
· predictive and preventive maintenance
Step 5. If a
constraint is broken, go back to step 1.
Continuous improvement to the performance of the system’s bottleneck may eventually result in the elimination or shifting of the constraints. In this case, the TOC steps will be started all over again, beginning with identifying the system’s constraints.
CONCLUSION
Stencil printing, pick-and-place, reflow, and wave soldering are typical processes used in the assembly of printed circuit board components. From a production point of view, the pick-and-place and the reflow are the processes that exhibit the most potential for becoming bottlenecks in a PCB manufacturing line. The application of the TOC can provide opportunities for improved throughput of the PCB assembly line.
From a capital investment point of view, the pick-and-place equipment requires the most expenditure and therefore should be designated as the bottleneck in electronic manufacturing. Improving the throughput of the electronics assembly line requires creating an optimal schedule for the pick-and-place equipment. Additional requirements are creation or enhancing of the logistical support that keeps the consumables and components available supporting the production schedule and focusing on continuously improving the performance of the equipment using a combination of technologies, tools, and techniques.
REFERENCES
[1] Evans, John L., and G. Jones, Evaluating
the Effects of Reflow Profile Control on Solder Joint Quality and Reliability,
Paper presented at the SMTA International Conference, Chicago, IL,
2002.
[2] Goldratt,
Eliyahu M., and J. Cox, The Goal,
Second Revised Edition, Croton-on-Hudson, N.Y.: North River Press, 1992.
[3]
Goldratt, Eliyahu M., Production – The TOC Way: Avraham
Y. Goldratt Institute, New Haven, CT, 1995.
[4]
Jensen, Tim, and R. C. Lasky, Practical
Tips in Implementing the “Pin in Paste” Process, Paper presented at the
SMTA International Conference, Chicago, IL, 2002.
[5] Landers, Thomas L., W. D. Brown, E. W. Earnest W., E. M. Malstrom, and N. M. Schmitt, Electronics Manufacturing Processes, Prentice-Hall, 1994.
[6]
Prasad, Ray P., Surface Mount Technology - Principles and Practice, Second Edition,
Kluwer Academic Publishers, 1997.
[7] Process Parameters Optimization for Mass Reflow of 0201 Components, [http://www.smtinline.com/html-en/uic0201.pdf] accessed June 2003.
[8]
Product Data Sheet for RMA-SMQ®51A
Solder Paste, [www.indium.com] accessed June, 2003.
[9] Rajkumar, D., T. Nguty, and N. Ekere, Optimizing Process Parameters for Flip Chip Stencil Printing Using Taguchi’s Method, Paper presented at the IEEE/CPMT International Electronic Manufacturing Technology Symposium, Santa Clara, CA, 2000.