
USB Data Acquisition Units in Engineering Technology Applications
|
Dale
H. Litwhiler |
Terrance D. Lovell |
ABSTRACT
The Universal Serial Bus (USB) has become a ubiquitous technology for computer peripherals. It is available on virtually every new computer and in most cases provides a seamless connection method for a variety of consumer electronics devices such as digital cameras, scanners and printers. This ease of connection together with the inherent high data rate of USB also makes this technology very useful for data acquisition and control units. This paper presents the use of USB data acquisition units in an electromechanical engineering technology laboratory environment. Features, advantages and disadvantages of the hardware are discussed. The LabVIEW™ software tools (virtual instruments) developed to interface with the USB device are presented. Examples of sensing and control systems experiments and projects are also given.
INTRODUCTION
The Universal Serial Bus (USB) has quickly found its way from consumer electronics (cameras, scanners, printers, cell phones, etc.) to laboratory equipment. The ease of connection and relatively high data rate of USB makes this technology very useful for portable data acquisition units. Several units are now available at very reasonable cost from companies such as LabJack, Measurement Computing Corporation and National Instruments. The unit currently used by engineering technology students at Penn State Berks is the LabJack™ U12. The LabJack U12 features are typical of the USB devices currently available. These features include multi-channel analog voltage input and output, digital I/O, event counter input and +5V power supply output (supplied from the host computer via the USB cable). This set of features makes these devices ideal for many types of engineering technology education applications.
Combining USB data acquisition hardware with the capabilities of LabVIEW™ software makes a very powerful and portable measurement and control system for laboratory/classroom experiments and hardware-in-the-loop (HIL) design projects.1 Unlike traditional ISA or PCI bus plug-in cards, the USB devices can be easily moved to different computers. When paired with a laptop computer, the system becomes completely mobile which provides many more application possibilities. The low cost of these USB data acquisition devices also makes them a viable option for students to purchase on their own for home experimentation. This capability greatly enhances the students’ learning process.2,3
The LabJack unit provides a very good interface for many types of transducers including temperature, position, velocity and acceleration/tilt sensors. Some sensors, however, require analog signal conditioning prior to connection to the LabJack to buffer or scale the signals. Further processing of signals acquired from these devices, as well as the graphical user interface is performed with LabVIEW software. This is where the real creativity of system design takes place. Using LabVIEW software, the range of applications that can be constructed around the USB devices is enormous. A set of LabVIEW virtual instruments (VI) has been developed for the LabJack U12 by the authors for use by engineering technology students. This paper presents and discusses the hardware and software features and capabilities of a USB data acquisition system for use in the engineering technology education environment. Examples of experiments and applications are also included.
HARDWARE
The LabJack U12 device is a lightweight USB peripheral device housed in a durable plastic case as shown in Figure 1. The unit is connected to the controlling computer via a standard detachable USB cable. Power for the U12 is obtained through the USB cable thus no external power supply is needed. Some of the external data acquisition and control signal connections are made through the screw terminals on top of the unit (screwdriver included!) while others are via a 25-pin D connector on the side.4
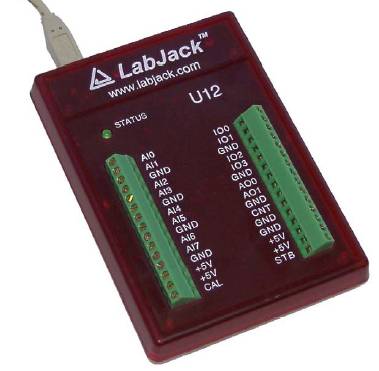
Figure 1: LabJack USB Data Acquisition Unit
The LabJack U12 has eight, 12-bit analog voltage inputs (AI0 – AI7) that can be configured via software for either single-ended or differential measurements. All analog input voltages must be between +10V and -10V with respect to unit ground (GND). When configured for differential input, the gain can be adjusted via software which increases the voltage resolution while proportionally reducing the span. The input bias current of the analog inputs is rather high (roughly 90μA) and is a predictable function of the input voltage as acknowledged by the manufacturer. Because of this input bias current, care must be taken when interfacing with high impedance sources. This issue is addressed later in an example application.
There are two analog outputs on the LabJack U12 (AO0 – AO1). Each analog output has a resolution of 10 bits over a ratiometric span from zero volts to the +5V USB power source voltage. The output impedance of each analog output is typically 20 ohms. If greater precision is needed or if the output is driving heavy loads, an analog input can be used to measure and correct the analog output voltage in software.
Digital inputs and outputs are available through the screw terminals (IO0 – IO3) and a D connector (D0 – D15) on the side of the LabJack U12 unit. All of these signals can be configured as either input or output, however, there are some differences between the “I/O” and the “D” digital inputs and outputs. The I/O connections have an internal 1.5kΩ resistor in series with the terminals to help protect from damage due to external short circuits to ground or +5V. This resistance thus also limits the current source and sink capability of this signal. D0 – D15 do not have any intentional source resistance and can therefore source and sink up to 25mA but care must be taken not to short circuit them to any low impedance voltages.
The digital inputs and outputs (both IO and D signals) are extremely useful for many applications. Since all inputs are sampled simultaneously, the U12 can be used as a low frequency, twenty channel logic analyzer. The digital outputs can also be used to form a stepper motor controller with all of the phasing and sequencing handled in software.
Another extremely useful feature of the LabJack U12 is the frequency/event counter input (CNT). This 32-bit counter input accepts TTL and CMOS logic levels and has a maximum frequency of 1MHz. Many transducer circuits are designed to produce a signal frequency output that is a function of the measured quantity.5 The U12 counter can be used to receive these signals which are then decoded (linearized) in software.
The +5V power supply output voltage available on the LabJack U12 is very convenient for powering analog and digital signal conditioning (glue) circuits. This voltage comes directly from the host computer (or a USB hub) and is therefore current limited by this equipment. Regardless of the source, at least 50mA will be available, which is more than enough to power op-amp or digital logic circuits.
SOFTWARE
Software drivers for the LabJack U12 are available for download directly from the manufacturer’s website.4 All of the necessary USB interface software is contained in one dynamic link library (DLL) file. There are also several utility/applications available for many platforms and operating systems. The LabVIEW examples available from LabJack are particularly useful because of the ease of programming and popularity of LabVIEW in engineering technology. These examples are easily dissected for use in custom applications.
The LabVIEW virtual instruments (VIs) described in the following examples have evolved over several semesters and through four versions of LabVIEW (from 6i to 7.1). The functions used in the examples are compatible with the latest revision of the LabVIEW student version which at the time of this writing is version 7 Express (7.0). By keeping this compatibility, students can experiment with the VIs with their own LabJack and personal computer at home.
EXAMPLES
The simple functionality of the LabJack together with the power of LabVIEW allows for the development of very sophisticated applications in measurement and control. The following examples demonstrate a range of possibilities. At first, the faculty developed basic VIs to get the students started. Soon, motivated students were taking these VIs to a whole other level of complexity.
THERMISTOR TEMPERATURE SENSOR
In this example, a negative temperature coefficient thermistor is used as a temperature sensor. The thermistor resistance changes as a function of temperature and can be approximated for a range of temperatures by an exponential expression. If the thermistor resistance is measured, the temperature, in degrees Celsius, of the thermistor can therefore be determined by an expression of the form:

In this expression, β, T0 and RT0 are constants for a given thermistor and RT is the measured thermistor resistance.
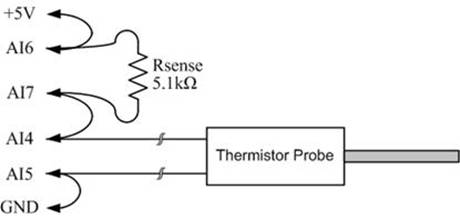
Figure 2: LabJack Wiring Diagram for Thermistor Experiment
In the first part of the experiment, the students use the LabJack to measure the resistance of the thermistor at various water bath temperatures. A laboratory thermometer is used as the reference. Figure 2 shows the thermistor connections to the LabJack. The LabJack is configured to make two differential voltage measurements. One differential voltage measurement is the actual thermistor voltage (AI4-AI5), while the other measurement is the current-sensing resistor voltage (AI6-AI7). The +5V power supply voltage of the LabJack is used to power the circuit so no other power supply is needed. Using this data, the students then estimate the values of β, T0 and RT0 using standard techniques. The estimated values for β, T0 and RT0 are then used to verify the performance of the model. Figure 3 shows the LabVIEW front panel for the VI used in this experiment. Figure 4 shows the corresponding LabVIEW block diagram.
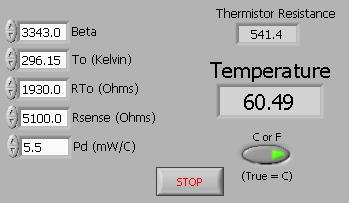
Figure 3: LabVIEW Front Panel for Thermistor Experiment
Figure 4: LabVIEW Block Diagram for Thermistor Experiment
Referring to Figure 4, the differential voltage measurements are made in the subVI blocks labeled, “LJ EAI.” These voltage measurements are then processed by the software (equation node) to determine the thermistor resistance, Rth. The Ib term is used to compensate for the input LabJack analog input bias currents as a function of the measured voltage. Also notice that a correction term for the self-heating effect of the thermistor is calculated by determining the power dissipated in the thermistor, Pth. Each of these corrections is easily handled in the software. The students quickly appreciate the power of the software to perform such operations.
ACCELEROMETER TILT SENSOR
This example uses the ADXL311 accelerometer from Analog Devices together with the LabJack and LabVIEW to produce a two-axis tilt sensor (pitch and roll). The ADXL311 is a solid state (MEMS) device and its characteristics are studied as part of a junior-level instrumentation course. For this application, a small circuit board was fabricated to hold the ADXL311 and the analog signal conditioning electronics. Figure 5 shows a schematic of the conditioning circuit board.
Figure 5: Accelerometer Signal Conditioning Schematic
The X and Y outputs of the ADXL311 produce a voltage that is a function of the respective axis acceleration with a zero-g level of 1.5V and a sensitivity of 167mV/g (with a supply voltage of 3.0VDC). Because this device is able to sense constant acceleration (minimum frequency includes zero), the acceleration due to gravity can be used to determine the physical orientation of the device (pitch and roll) with respect to the surface of the earth.6


The signal conditioning board was designed by a motivated engineering technology student (second author of this paper). The ADXL311 is only available in a ceramic leadless chip carrier package so a printed circuit board is needed to make reliable connection to the device. The circuit board also provides a regulated 3.0VDC supply voltage (derived from the LabJack +5V output) for the ADXL311 as well as buffer amplifiers for the high impedance X and Y acceleration outputs. The zero-g voltage for the X and Y outputs is one-half of the supply voltage. In order to provide the highest resolution, a one-half VDD reference voltage is developed on the board (R3, R4 divider). The X and Y outputs are then measured differentially with respect to this reference using the LabJack analog inputs. The differential analog input voltages are then amplified using the LabJack amplifiers to obtain the highest possible resolution. The circuit board was also designed such that the external connection points align with the respective LabJack terminals for ease of wiring. Figure 6 shows a photograph of the circuit board mounted on the LabJack U12.
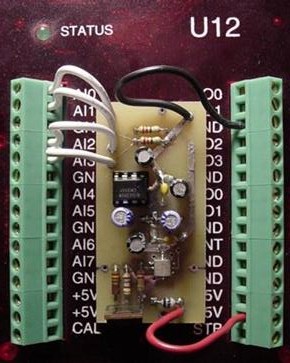
Figure 6: Accelerometer Circuit Board on LabJack
The LabVIEW software for the tilt sensor reads the LabJack analog inputs corresponding to the accelerometer X and Y outputs in a continuous loop. Figure 7a shows the LabVIEW front panel for this application the block diagram is shown in Figure 7b. The user can choose to average the readings to help smooth the response if needed. The raw voltage readings are displayed as well as values that are corrected via a simple calibration procedure. To calibrate the system, the user places the accelerometer parallel to the horizon and notes the X and Y output readings. These readings are entered as the Pitch and Roll Center value for each axis. The user then rotates the accelerometer through plus and minus 90 degrees in both the pitch and roll directions and notes the maximum and minimum voltages. These readings are entered as the appropriate Left, Right, Up and Down values. The software then uses all of these readings as correction factors in the final output display. The polar plot displays the current attitude of the accelerometer in the same manner as an aircraft “Artificial horizon” instrument.

Figure 7a: LabVIEW Front Panel of Accelerometer Tilt Sensor VI
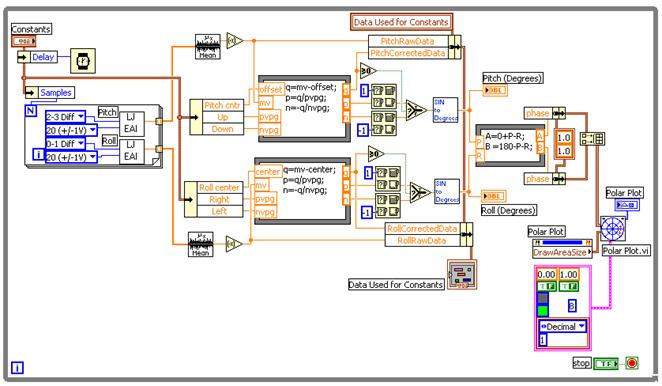
Figure 7b: LabVIEW Diagram of ADXL311 Tilt Sensor VI Example
In the laboratory experiment, the pitch and roll angles of the accelerometer circuit board are measured and compared to the displayed results. The offset and full-scale readings are used to calibrate the setup and the procedure is repeated. Results are recorded and compared. The polar attitude display gives the experiment a game-like feel which helps to retain the students’ interest and aids in the understanding of the tilt sensor’s operation.
FUNCTION GENERATOR CONTROL
In this example of closed-loop control, the output frequency of a laboratory function generator is controlled and measured with the LabJack U12. The function generator output frequency is controlled via its voltage-controlled oscillator (VCO) input using a LabJack analog output voltage signal. The function generator output frequency is measured with the LabJack counter input.
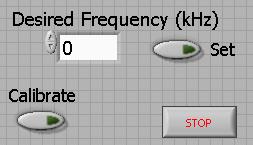
Figure 8: LabVIEW Front Panel for Function Generator Example
The function generator used for this example is the BK Precision Model 4011. The output frequency, regardless of wave shape and frequency range selected, varies linearly as function of the VCO input voltage. An increasing VCO input voltage produces a decreasing output frequency.
Figures 8 and 9 show the LabVIEW front panel and block diagram for this example. When started, the LabVIEW VI first enters a calibration routine in which the VCO voltage, produced by a LabJack analog output, is stepped from +5V down to zero in 0.25V increments. The output frequency (from the TTL output jack) is measured with the LabJack counter at each step to create a calibration table. Through interpolation, this table is then used to choose the required VCO input voltage to achieve the desired function generator frequency set by the user.
Figure 9: LabVIEW Diagram for Function Generator Example
CAPACITIVE POSITION TRANSDUCER
The frequency/event counter of the LabJack U12 is used in this experiment to
demonstrate the function of a position-to-capacitance transducer. The
transducer is the TK294H by Feedback Inc. shown in Figure 10. The transducer
construction forms a coaxial capacitor such that the area of overlap between the
inner and outer conductive cylinders is a function of the plunger position.
Thus the capacitance is a function of plunger position. A short twisted pair
of wires is used to connect the transducer to the oscillator circuit.
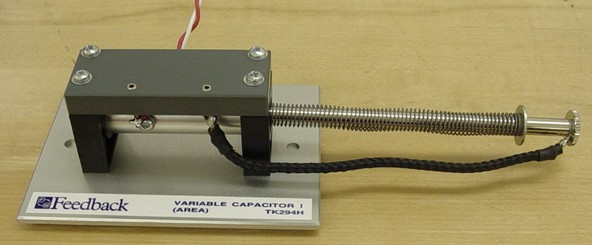
Figure 10: Variable Capacitance Position Transducer
This variable capacitor is placed in an oscillator circuit to produce an output
frequency that is a function of position. The oscillator for this system uses
the 555 timer circuit shown in Figure 11 where Ct is the transducer capacitance.
Notice that the circuit is powered directly from the LabJack's +5V output so no
other equipment is required.
Figure 11: Capacitive Position Transducer Oscillator Circuit
The transducer and oscillator system must first be calibrated by the students.
The plunger is placed at several known positions and the corresponding
oscillator frequency is measured using the LabVIEW virtual instrument shown in
Figures 12a and 12b. The position and frequency data is entered into a
spreadsheet formatted text file. This calibration data file is then used by the
frequency-to-position VI shown in Figures 13a and 13b.
Figure 12a: Frequency Counter VI Front Panel
Figure 12b: Frequency Counter VI Block Diagram
Figure 13a: Frequency to Position Converter VI Front Panel
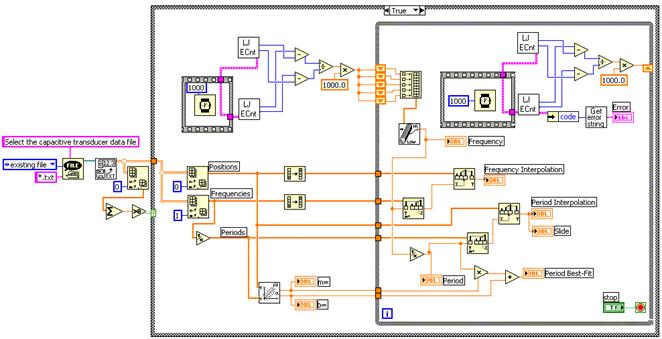
Figure 13b: Frequency to Position Converter VI Block Diagram
The Frequency to Position VI has many features to help the students understand the relationship between the position of the plunger and the frequency and period of the oscillator. The concepts of a static calibration curve and its use are demonstrated by the frequency and period interpolation performed by the VI. The least-squares best fit of the oscillator period data is also computed and used as yet another way of estimating the position of the plunger from the measured frequency. Notice in Figure 13b that the measured frequency data is passed through a median filter to help smooth the displayed results. It is important that engineering technology students recognize and become familiar with this type of data manipulation that is made possible by virtual instrumentation.
SUMMARY AND CONCLUSIONS
The LabJack U12 is well received by the engineering technology students. These students are very familiar with consumer electronic USB devices such as digital cameras and file storage devices and are therefore comfortable with the technology. In the laboratory, the students quickly have the units connected to the computer and ready for assembling the experiment setup. The screw terminal strips make it easy to wire many small circuits directly on the LabJack without the need for an extra wiring board. The students have become quite skilled at this wiring practice. The screwdriver that is included with each unit is carefully guarded by each lab group and is jokingly referred to as the most important piece of equipment in the lab.
The toy-like appearance of the LabJack U12 causes some students to doubt its relevance to equipment used in industry. These students are referred to literature from such companies as National Instruments, Measurement Computing Corporation and Dataq all of which produce equipment with similar specifications for industrial applications. Whether they see it as a toy or a tool, engineering technology students appreciate the sophisticated measurement systems that can be created around the LabJack. A few students have even been so motivated as to purchase their own LabJack for home use in various hobby applications.
The popularity of the LabJack units at Penn State Berks continues to grow. More faculty members are now interested in applications of the U12. One of these applications uses the LabJack digital outputs to control a stepper motor. The LabVIEW software then provides a user interface to allow students to experiment with motor rotation directions, step rates and various angles and fixed numbers of steps.
USB data acquisition devices provide a very flexible interface for getting real-world measurements into a computer and for controlling real-world processes with a computer. The power and ease of use of LabVIEW software provides an excellent means for engineering technology students to analyze measurements and implement control schemes. Students can quickly create very sophisticated applications at very reasonable cost. Here the students can begin to appreciate how software can be created to perform the work of the system once the external measurements have been acquired. Examples presented here are just a small sampling of the kind of systems that can be created with this combination of hardware and software.
BIBLIOGRAPHY
[1] Litwhiler, D. H., “A Simple Software and Hardware System Solution for Process Measurement and Control in Engineering Technology Student Design Projects,” Proceedings of the American Society for Engineering Education Annual Conference and Exposition, 2004.
[2] Rogers, C., “Data Acquisition for the Dorm Room: Teaching Experimentation Techniques Using LEGO Materials,” Proceedings of the American Society for Engineering Education Annual Conference and Exposition, 2001.
[3] Braun, C. G., “Experiments on the Cheap: Using a Student Data Acquisition System,” Proceedings of the American Society for Engineering Education Annual Conference and Exposition, 1997.
[4] http://www.LabJack.com.
[5] Johnson, Curtis D., Process Control Instrumentation Technology, 7th edition, Prentice-Hall, 2003, pp 148-153.
[6] http://www.analog.com/UploadedFiles/Data_Sheets/39398238692761ADXL311_a.pdf