
Volume 4, Number 2, Spring 2004
Design and Analysis
of an Air-Filter Sensor for a Residential Heating and Cooling System
Cheng Y. Lin,
Steve C. Hsiung,
Alok K. Verma,
Gary R. Crossman
Department of Engineering Technology
e-mail: clin@odu.edu, shsiung@odu.edu
ABSTRACT
This is a design project of an air-filter sensor to
be used in home heating and cooling system. The project includes conceptual
design, analysis, implementation, tests and modifications. First, the air
quality and power consumption between a clean air filter and a dirty air filter
is studied. Then, a photo sensor circuit with an ultra high brightness LED
emitter and a phototransistor receiver is used to detect dust particles. A
red warning LED lights up when a specified amount of dust is collected on
the filter and blocks the light beam between the emitter and the receiver.
The emitter and receiver are mounted on a simple fixture and can be easily
fitted on any air filter. In addition, the cost analysis shows that this design
can significantly reduce the electricity bill if the filters are properly
replaced.
INTRODUCTION
A vital part of Engineering Technology (ET) education is
the implementation of senior project designs to provide students with the
opportunity to apply knowledge gained in other courses to solve practical
problems. Engineering Technology students at
DESCRIPTION OF THE PROJECT
When a clean air filter is installed in a heating, ventilation
and air conditioning (HVAC) system, people usually forget to replace it because
it does not have significant impact on the operation of a HVAC system. However,
when the air filter became dirty and remained unchanged, the air quality will
deteriorate, and efficiency of the HVAC system will also be reduced [1,2,3].
Since there is no paper or patent discussing this issue, a senior project
team is formed to investigate this problem and design an air-filter sensor
for a residential HVAC system. There are two teams working on the project.
Team 1 performs the design analysis and fabricated the components [4]. Team
2 does air quality tests, cost analysis and testing [5].
Primary objectives of the project are as follows:
1. Measure the air quality difference between a clean and a dirty air filter.
2. Measure the increase in power consumption when using a dirty filter.
3. Design a reliable and low cost sensor, which will be able to send a warning signal when an air filter becomes dirty.
4. Design a simple installation method for the sensor.
5. Perform a cost analysis for the implementation of the device.
AIR QUALITY TEST
The major purpose of installing an air filter in a residential
HVAC system is to block the dusty air particles from the incoming air and
remove contaminants introduced into the re-circulated air from conditioned
space [1]. When a new filter is just installed, it provides little resistance
to the airflow. The low resistance provides little friction loss in the system
and thus requires less energy for the air mover (motor) than a system with
a dirty filter. A clean air filter also produces better air quality and faster
response to temperature adjustment during the same operation period of a HVAC
system while compared to a dirty/blocked filter. To better analyze the change
of the airflow between a clean filter and a dirty filter, a simple apparatus
was developed in the ET program [4,5]. This apparatus is a rectangular box
that has a fan and motor with openings at the fan discharge and suction ends.
The suction end has provisions for the installation of a standard small HVAC
filter and a solid sliding gate that covers all or portions of the entrance.
Figure 1 shows the apparatus with a filter and 50% of its area blocked. The centrifugal fan used in this test was driven by a ¾ HP Westinghouse motor. Results of the initial tests were recorded in Table 1, where the average airflow velocity dropped from 820 ft/min with no blockage to 40 ft/min with a blockage of 75% of its total area. The average velocity was measured at the discharge opening that was the same size as the filter. The current drawn by the fan motor was 10.9A with a clean filter versus 9.2A with a 75% blocked filter [5]. Table 3 shows the test results of comparison between a clean and dirty filter in a HVAC system. Within these 11 tests, the average current draw was 11.0A when a clean filter was in place, and 10.5A resulted from a dirty filter. The average airflow velocity was 833 ft/min for a clean filter and 677 ft/min for a dirty filter.
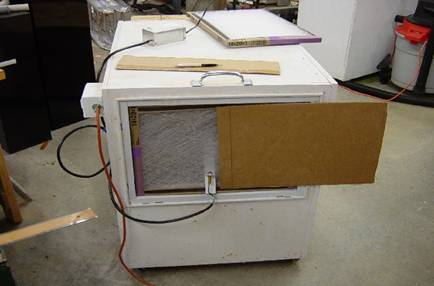
Figure 1. Tests
on an Air Filter Blocked by 50% of Its Area
The air quality was measured on a Terra Universal
Particle Concentration Meter (PCM) [7], which counts the number of dusty air
particles with the diameter of the dusty particle greater than 3 microns within
a cubic foot. The results of the experimental measurements are presented in
Tables 2 and 4. Table 2 shows that a clean air filter can reduce the number of
dusty particles to 77%, while Table 4 shows a dusty filter can only reduce
particles to 41.5% [5].
Filter Blockage
|
Current Draw (A)
|
Air Velocity (ft/min)
|
No blockage
|
10.9
|
820
|
25 percent blocked
|
10.1
|
520
|
50 percent blocked
|
9.6
|
470
|
75 percent blocked
|
9.2
|
40
|
Table 1. Results
of Tests from Figure 1
|
Air Quality Test No. |
Initial PCM reading (ppm) |
PCM reading 2.5 hrs later (ppm) |
Difference
|
Percent (%) Difference |
|
1 |
667,800 |
187,500 |
480300 |
71.9 |
|
2 |
1,111,100 |
226,800 |
884,300 |
79.6 |
|
3 |
649,000 |
135,900 |
513,100 |
79.1 |
|
4 |
518,200 |
77,400 |
440,800 |
85.1 |
|
5 |
67,300 |
36,000 |
31,300 |
46.7 |
|
6 |
108,100 |
45,800 |
62,300 |
57.6 |
|
7 |
129,200 |
31,000 |
98,200 |
76 |
|
Average |
3,250,700 |
740,400 |
2,510,300 |
77.2 |
Table 2. Air
Quality Test Results of a Clean Filter
|
Test No. |
Current Draw (A) |
Air Velocity (ft/min) |
|
Test 1 with clean filter |
10.4 |
800 |
|
Test 1 with dirty filter |
10.0 |
670 |
|
Test 2 with clean filter |
10.7 |
830 |
|
Test 2 with dirty filter |
10.4 |
690 |
|
Test 3 with clean filter |
11.0 |
770 |
|
Test 3 with dirty filter |
10.5 |
670 |
|
Test 4 with clean filter |
10.8 |
820 |
|
Test 4 with dirty filter |
10.3 |
670 |
|
Test 5 with clean filter |
11.2 |
850 |
|
Test 5 with dirty filter |
10.7 |
680 |
|
Test 6 with clean filter |
10.9 |
830 |
|
Test 6 with dirty filter |
10.6 |
720 |
|
Test 7 with clean filter |
11.1 |
870 |
|
Test 7 with dirty filter |
10.6 |
680 |
|
Test 8 with clean filter |
11.1 |
830 |
|
Test 8 with dirty filter |
10.6 |
660 |
|
Test 9 with clean filter |
11.4 |
840 |
|
Test 9 with dirty filter |
10.2 |
610 |
|
Test 10 with clean filter |
11.2 |
840 |
|
Test 10 with dirty filter |
10.6 |
710 |
|
Test 11 with clean filter |
11.3 |
870 |
|
Test 11 with dirty filter |
10.6 |
690 |
Average for clean filter
|
11.009 |
832.82 |
Average for dirty filter
|
10.464 |
677.273 |
Table 3. Current
Draw and Airflow on a Clean and Dirty Filter
|
Air Quality Test No. |
Initial PCM reading (ppm) |
PCM reading 2.5 hrs later (ppm) |
Difference
|
Percent (%) Difference |
|
1 |
78,500 |
63,000 |
15,500 |
19.7 |
|
2 |
109,500 |
63,500 |
46,000 |
42 |
|
3 |
118,700 |
73,800 |
44,900 |
37.8 |
|
4 |
124,800 |
71,600 |
53,200 |
42.6 |
|
5 |
141,400 |
81,500 |
59,900 |
42.4 |
|
6 |
110,200 |
61,500 |
48,700 |
44.1 |
|
7 |
138,600 |
65,400 |
73,200 |
52.8 |
|
Average |
821,700 |
480,300 |
341,400 |
41.5 |
Table 4. Air
Quality Test Results of a Dirty Filter
POWER CONSUMPTION
The
difference in calculation of the power consumption between a clean and a dirty
air filter can also be retrieved from the tested data in Table 3. In these
tests, the averaged data of a clean and dusty air filter are approximately
832 ft/min in airflow with 11.0A current draw and 677 ft/min in air flow with
10.5A current draw, respectively. It took longer to have the same amount of
airflow for the dirty filter than the clean one by a factor of 832/677 or
1.23 that was used in the power consumption calculations. When the fan motor
was running in an actual HVAC system, a current draw of 25A was assumed in
a HVAC unit. It was also assumed that both systems have the same power factor.
Usually, it is less than one and reduces the energy consumption slightly.
The following are the power consumption cost calculations in running the systems
five hours a day for a 30-day period.
Unblocked Filter Power Consumption Cost Calculations:
I = Current
V = voltage
Power Consumption / Sec = P = IV = (11.009 + 25) x 120 = 4321.08 joules /Sec
Power Consumption / Hr = 4321.08 x 3600 sec/hr = 1.55559 x 10⁷ Joules/hr
Power Consumption / Month = 1.55559 x 107 x 150 hrs = 2.33 x 10⁹ Joules = 648 KWH.
Energy Cost = $0.10 per KWH,
Energy Cost /Month = 648 x 0.10 = $64.80
Blocked Filter Power
Consumption Cost Calculations:
Power Consumption / Sec = P = IV = (10.464 + 25) x 120 = 4255.68 joules /Sec
Power Consumption / Hr = 4255.68 x 3600 sec/hr = 1.53 x 10⁷ Joules/hr
Power Consumption / Month = 1.53 x 107 x 1.23 x 150 hrs = 2.83 x 10⁹ Joules = 785 KWH.
Energy Cost = $0.10 per KWH,
Energy Cost /Month = 785 x 0.10 = $78.50
The
savings for using a clean air filter are about $13.70 per month, which is
about 20% of the total HVAC bill in this case.
DESIGN OF THE AIR-FILTER
SENSON
The air-filter sensor design is part of the objectives
that require the sensor to be reliable and easily fit. One of the designs
proposed by students (Team-1) included the installation of a pair of differential
pressure sensors mounted on either side of the air filter. When the pressure
drop reaches a specified value, a signal will be sent out to activate a warning
LED or light. This design, however, needs a significant number of calibrations
on the sensing circuit for different types of HVAC systems. It also requires
special techniques when installing the sensors on the HVAC system. The sensitivity
of this design is another concern.
Home-use air filters are generally translucent, and
low-production cost of the sensing circuit is the prime consideration. The
faculty recommended a simpler design using photoelectric sensors for this
purpose. The design includes a light emitter and a photo receiver. The light
emitter emits a beam of light (660 nm), and the receiver detects the amount of
light that passes through the filter [6]. If the light beam is partially or
fully blocked, the sensor will send a signal to activate the red LED that
serves as a warning signal. Two different positions of the sensors are
presented in Figure 2, the opposed sensing mode and Figure 3, the
retro-reflective sensing mode.
Figure 2. Opposed Sensing Mode
Figure 3. Retro-Reflective Sensing Mode
According to the information from Banner
Engineering Corporation [8], opposed mode sensing is the most efficient sensing
mode and offers the highest level of sensing energy to overcome atmospheric
contamination and sensor misalignment. Retro-reflective sensing mode, however,
can be applied when the space on one side is limited. The beam pattern emitted
from the emitter can cover a circular area with an approximate five-inch
diameter. If an excess gain on the light is used, the beam intensity can
increase up to 150 times with an opposing distance of 1 ft. Therefore, the
reliability and sensitivity of placing sensors in an opposed direction are
higher. This is why the opposed sensing module was chosen in this design where
an ultra high brightness LED and a phototransistor were used as a pair of the
sensing unit (D4 & Q1) [6]. Two additional transistors (Q 2 & Q3) and
associate resistors (R3, R4, & R5) were used to drive red (D3) and green
(D2) LEDs for proper indication of the air filter condition. If the filter is
clean, the green LED will light. A red light LED was used to indicate a
dirty/blocked filter. The supply power to this circuit was regulated through a
wall-mount transformer to 5 V power. The detail schematic of this design is
presented in Figure 4. As shown in Figure 5, a simple bracket was designed so
that it can fit in most of the residential HVAC units. When the light from the
emitter is not blocked, a green LED was on as shown in Figure 5. Figure 6 shows
that the red LED was on when the filter became dirty. The total cost of this
prototype design is under $100.00. This cost can be substantially reduced in a
mass-production case.
Figure 4. Schematic of the Photo/Light
Sensor
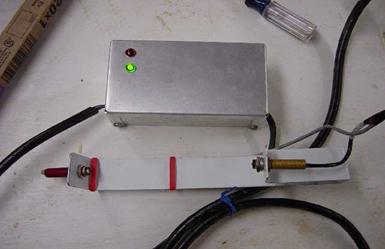
Figure 5. Air-Filter
Sensor with Green On When Sensing Light Is Not Blocked
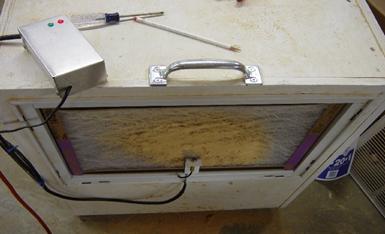
Figure 6. Air-Filter with a Red LED On When Sensing Light Is Blocked
Sensors Power Consumption Cost Calculations:
Power Consumption / Sec = P = IV = 8.17 x 10-3 x 120 = 0.98 joules /Sec
Power Consumption / Hr = 0.98 x 3600 sec/hr = 3529 Joules/hr
Power Consumption / Month = 3529 x 720 hrs = 2.54 x 10⁶ Joules = 0.705KWH.
Energy Cost = $0.10 per KWH,
Energy Cost /Month = 0.705 x 0.10 = $0.07
Based on above calculations, the electric bill per
month for using the sensor is negligible.
SUMMARY
This
project presents an approach for ET students to study and solve the problem
of when to replace the air filters of a residential HVAC unit. The sensor
was designed and tested. Preliminary tests show that, if a dirty filter is
not replaced, then the indoor air quality will aggravate, as the filter loses
its function. A dirty filter will also increase the energy bill due to the
reduced airflow when compared to a clean air filter. The sensor presented
in this paper is very reliable and can be fitted easily to most indoor air
filters, which are translucent. The cost of the sensor can be reduced to less
than $100.00 in mass production, and the energy consumption of the sensor
itself is just a fraction of $0.07/month. The calculated energy savings by
using clean filters are approximately $14.00/month. The cost of this sensing
unit will be easily justified in less than a year.
Bibliography
[1] F.C. McQuiston, J.D. Parker,
and J.D. Spitler, Heating, Ventilating, and Air Conditioning
Analysis
and Design,
[2] W.P. Jones, Air
Conditioning Engineering,
[3] R. K. Schneider, HVAC
Control Systems,
1988.
[4] T. Anderson, J. Atkins &
A. Meacham, “Air Filtration Detection Devices”, Old Dominion
University,
Senior Design Project, December, 2001.
[5] G. Morris, “Validation of the
ODU Filter-Sensing Device”,
Project
Report, November, 2002.
[6] Stanley Electric Co.,
Ltd., <www.stanley.co.jp/device/e/e_index.html>,
accessed May 2004.
[7] User’s Manual, Hand-Held Particle Concentration Meter/Particle
Counter,
<www.terrauniversal.com/products/measuring/handheldpart.shtml>,
accessed June 2004.
[8] User’s Manual, Photoelectric Emitters, Receivers, and the Light
Spectrum,
<www.bannerengineering.com/literature_resources/tutorial/old/1_sensing_intro.html>
,
accessed June 2004.