
Volume
4, Number 2, Spring 2004
Tensile Strength and Optimization of Injection Molding Processing Parameters Using the Taguchi Method
|
Jie Zhu Industrial Technology Department of Agriculture & Biosystems Engineering |
Joseph C. Chen Industrial Technology Department of Agriculture & Biosystems Engineering |
|
E. Daniel Kirby Industrial Technology Department of Agriculture & Biosystems Engineering 102 edkirby@iastate.edu |
ABSTRACT
Tensile behavior of plastics plays an important role in defining the quality of injection-molded products. Many studies have shown that the tensile behavior of a product is influenced by the processing parameters governing injection-molding processes. This study employs Taguchi Parameter Design to systematically investigate the influence of injection molding processing parameters on the tensile strength of general purpose polystyrene (GPS). The results show that holding pressure and GPS melt temperature significantly affect tensile strength, while the room temperature noise-factor has no significant effect. The optimal conditions for the strongest tensile strength specimens are experimentally verified by the Taguchi Parameter Design. The match between the verification run and prediction from the optimal factor settings indicates that the Taguchi Parameter Design is very practical in optimizing the tensile properties of injection-molded products.
INTRODUCTION
The plastic injection molding process is a nonlinear,
multivariable process that forms plastic material into useful parts to meet
consumer needs.1 This process allows for fast, efficient mass
production of complex, three-dimensional parts with relatively low production
cost. However, injection molding remains a complex process and includes several
factors that can affect final part quality, such as materials, part and mold
design, and processing parameters.2
Tensile properties are important factors in defining the
quality of injection-molded products. These properties are influenced by the
processing parameters governing injection molding processes, as many studies
have shown. Fung, et al. investigated the
effect of injection molding process parameters on the tensile properties of
short, glass, fiber-reinforced polybutylene terephthalate (PBT) and found that
the strength of PBT depended on the thickness of the layer where fibers were
oriented in the loading direction. Process parameters also strongly influenced
the layer thickness of PBT.3 Cambell, et al. studied the effect of injection molding process
parameters on the tensile and impact strength of polypropylene, concluding that
the processing parameter interactions significantly impacted the part’s
mechanical properties.4 Chen, et al. investigated the effect
of processing conditions including injection speed, melt temperature, mold
temperature, and packing pressure on tensile properties of polycarbonate
thin-wall parts, finding that the part’s tensile strength increased with
increased melt temperature, mold temperature, and injection speed.5
Inappropriate settings for processing parameters (such as mold temperature, nozzle and barrel temperature, injection speed and pressure, holding pressure and time, and cooling time) can result in products with weaker tensile strength or lower quality. Therefore, determining the appropriate set-points for the processing parameters is imperative for optimizing injection molding operations.
There are various methods for controlling processing parameters. Many expert systems have been used to assist in determining the set-points for the processing parameters in view of the mechanical strength.6, 7, 8, 9 Unfortunately, these systems are inadequate for situations requiring a quantitative value for the processing parameters. Another approach is to apply optimization techniques (such as design of experiment [DOE] methods) to identify the most significant factors affecting part tensile properties and offer optimal conditions for the best tensile properties.
A technique similar to DOE is the Taguchi Parameter Design.
This method is a breakthrough that offers the same effectiveness as traditional
DOE but with far fewer experimental runs.10 The Taguchi Parameter
Design bases the experimental design on orthogonal arrays, which dictate the
combination of factors and levels to be tested. The benefit of using orthogonal
arrays is that a large amount of information from the effects of many
processing parameters can be obtained from relatively few experiments.11
Reducing the number of experiments allows experimenters to simultaneously
optimize mechanical properties, quality, and cycle time for product
development. A large body of recent research has proven the Taguchi Parameter
Design’s effectiveness in setting the optimum processing parameters in
injection molding to obtain good tensile or impact strength, weldline strength,
less shrinkage, or better part quality.12, 13, 14, 15
PURPOSE OF STUDY
This study will investigate the significant effects of injection molding processing parameters on the tensile strength of polystyrene (PS). This study has two objectives:
1. To identify the most important processing parameters affecting the tensile behavior of PS.
2. To experimentally verify, using the Taguchi Parameter Design, the optimized conditions leading to optimum tensile properties in injection-molded samples.
EXPERIMENTAL DESIGN
General purpose polystyrene (GPS) was used as the main material in the study. This GPS was purchased from BASF under the trade name PS 2124. Its melt index is 8.0g/10min. A four-cavity, T-style MUD® Quick Change Insert Mold (Master Precision Molds, Inc.) was used to generate rectangular bars for tensile property measurement as recommended in ASTM D-638-95.16 A 22.4-ton injection molding machine (Boy 22M) (shown in Figure 1), with a fully closed-loop microprocessor control system (Procan CT color touchscreen interactive microprocessor control) and a mold temperature controller (Model 4410-C of Sterling, Inc.), was used to prepare tensile test samples at various conditions.
Before producing the PS tensile bar, an optimal process window was first determined by inputting resin, machine, and part geometry information into a Dr. C-Mold software package (Dr. C-mold of Advanced CAE Technology, Inc.). The optimal process window was used as a reference to set the orthogonal array for the Taguchi Parameter Design.
A modified L16 orthogonal array with four factors at four levels and three factors at two levels was used for the experimental design. The control factors at four levels were melt temperature, injection pressure, cooling time, and mold temperature. The control factors at two levels were holding pressure, injection speed, and holding time. These control factors are shown in Tables 1, 2, and 3.
Many noise-factors that can be controlled in the lab, such
as workshop temperature, relative humidity, and altitude, cannot be controlled
in real-life manufacturing situations without adversely impacting customer
satisfaction or adding cost. Room temperature, however, can be controlled and
thus was selected as the noise-factor in this research. A temperature range of
65-70ºF was selected to simulate normal working conditions and 80-85ºF to
simulate higher-temperature working conditions, such as summer in
|
|
|
|
Figure 1. Boy 22M Injection Molding Machine |
Figure 2. Instron Tensile Tester |
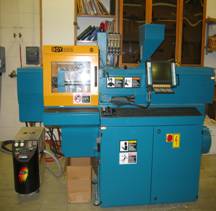
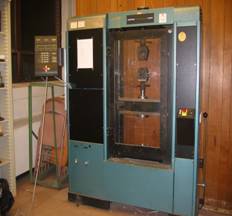
Table 1. Modified L16 orthogonal array
|
Inner Control Factor Array |
|||||||
|
|
|
|
|
|
|
|
|
|
Run |
A |
B |
C |
D |
E |
F |
G |
|
|
|
|
|
|
|
|
|
|
1 |
1 |
1 |
1 |
1 |
1 |
1 |
1 |
|
2 |
1 |
2 |
2 |
1 |
2 |
2 |
2 |
|
3 |
1 |
3 |
3 |
2 |
3 |
1 |
2 |
|
4 |
1 |
4 |
4 |
2 |
4 |
2 |
1 |
|
5 |
2 |
1 |
2 |
2 |
1 |
2 |
1 |
|
6 |
2 |
2 |
1 |
2 |
2 |
1 |
2 |
|
7 |
2 |
3 |
4 |
1 |
4 |
2 |
2 |
|
8 |
2 |
4 |
3 |
1 |
3 |
1 |
1 |
|
9 |
3 |
1 |
3 |
1 |
4 |
2 |
2 |
|
10 |
3 |
2 |
4 |
1 |
3 |
1 |
1 |
|
11 |
3 |
3 |
1 |
2 |
2 |
2 |
1 |
|
12 |
3 |
4 |
2 |
2 |
1 |
1 |
2 |
|
13 |
4 |
1 |
4 |
2 |
2 |
1 |
2 |
|
14 |
4 |
2 |
3 |
2 |
1 |
2 |
1 |
|
15 |
4 |
3 |
2 |
1 |
4 |
1 |
1 |
|
16 |
4 |
4 |
1 |
1 |
3 |
2 |
2 |
Table 2. GPS seven control factors, noise-factor, and their settings.
|
Parameter |
|
Level |
Settings |
|
A = injection pressure (psi) |
|
1 |
1100 |
|
|
|
2 |
1300 |
|
|
|
3 |
1500 |
|
|
|
4 |
1700 |
|
B = melting temperature (oF) |
|
1 |
440 |
|
|
|
2 |
450 |
|
|
|
3 |
460 |
|
|
|
4 |
470 |
|
C = Cooling time (sec.) |
|
1 |
20 |
|
|
|
2 |
25 |
|
|
|
3 |
30 |
|
|
|
4 |
35 |
|
D = injection speed (%) |
|
1 |
85 |
|
|
|
2 |
95 |
|
E = mold temperature (oF) |
|
1 |
95 |
|
|
|
2 |
105 |
|
|
|
3 |
115 |
|
|
|
4 |
125 |
|
F = holding pressure (psi) |
|
1 |
400 |
|
|
|
2 |
600 |
|
G = holding time (sec.) |
|
1 |
10 |
|
|
|
2 |
20 |
|
Noise-factor room temperature (oF) |
|
1 |
65-70 |
|
|
|
2 |
80-85 |
Table 3. Injection molding experimental design
|
Run No. |
Inner control factor array |
Outer noise array Room temperature |
|||||||
|
|
A (psi) |
B (oF) |
C (sec.) |
D (%) |
E (oF) |
F (psi) |
G (sec.) |
65-70 (oF) |
80-85 (oF) |
|
1 |
1100 |
440 |
20 |
85 |
95 |
400 |
10 |
|
|
|
2 |
1100 |
450 |
25 |
85 |
105 |
600 |
20 |
|
|
|
3 |
1100 |
460 |
30 |
95 |
115 |
400 |
20 |
|
|
|
4 |
1100 |
470 |
35 |
95 |
125 |
600 |
10 |
|
|
|
5 |
1300 |
440 |
25 |
95 |
95 |
600 |
10 |
|
|
|
6 |
1300 |
450 |
20 |
95 |
105 |
400 |
20 |
|
|
|
7 |
1300 |
460 |
35 |
85 |
125 |
600 |
20 |
|
|
|
8 |
1300 |
470 |
30 |
85 |
115 |
400 |
10 |
|
|
|
9 |
1500 |
440 |
30 |
85 |
125 |
600 |
20 |
|
|
|
10 |
1500 |
450 |
35 |
85 |
115 |
400 |
10 |
|
|
|
11 |
1500 |
460 |
20 |
95 |
105 |
600 |
10 |
|
|
|
12 |
1500 |
470 |
25 |
95 |
95 |
400 |
20 |
|
|
|
13 |
1700 |
440 |
35 |
95 |
105 |
400 |
20 |
|
|
|
14 |
1700 |
450 |
30 |
95 |
95 |
600 |
10 |
|
|
|
15 |
1700 |
460 |
25 |
85 |
125 |
400 |
10 |
|
|
|
16 |
1700 |
470 |
20 |
85 |
115 |
600 |
20 |
|
|
RESULTS AND DISCUSSION
Table 4 shows the results of the tensile strength (stress)
of each experimental run. The signal-to-noise (S/N) ratio is added to the last
column and is calculated using the following formula used for
“the-larger-the-better” case:11
 , (1)
, (1)
where
![]() = S/N ratio,
= S/N ratio,
![]() the individual tensile
strength (stress) measurements in each row of the
the individual tensile
strength (stress) measurements in each row of the
Excel file,
![]() total number of stress
results under each run.
total number of stress
results under each run.
As shown in Table 4, since S/N ratios have not changed significantly, no anomalies were introduced in the measurements or calculations. Based only on the observation of the stress data shown in Table 4, it seems that higher room temperatures (noise-factor) might have increased the stress in most of the experimental runs; however, increased room temperature also reduced the stress in some of the runs. Therefore, it is hard to determine whether the room temperature had a significant effect on the stress for all the control factors.
A simple statistical t-test or F-test for the noise-factor of room temperature validated this result (see Table 5). The high p-value shows that, with 95% confidence, the noise-factor had no significant effect on stress. Thus, the small effect of room temperature may be ignored
The results of stress ![]() (mean response
variable) effects and S/N ratio effects for all seven factors at different
levels are shown in Tables 6 and 7, respectively. Table 6 shows the effect of
each control factor on the mean stress; Table 7 shows the effect of each
control factor on the mean of the S/N ratio. Figure 3 shows the effect of each
of the seven control factors on stress and S/N ratio. These response plots show
how the stress changes with each factor. Figure 3 illustrates the best levels
to be chosen as optimal processing parameters for both the-larger-the-better
stress and the ideal S/N ratio, which we desire to be as large as possible.
(mean response
variable) effects and S/N ratio effects for all seven factors at different
levels are shown in Tables 6 and 7, respectively. Table 6 shows the effect of
each control factor on the mean stress; Table 7 shows the effect of each
control factor on the mean of the S/N ratio. Figure 3 shows the effect of each
of the seven control factors on stress and S/N ratio. These response plots show
how the stress changes with each factor. Figure 3 illustrates the best levels
to be chosen as optimal processing parameters for both the-larger-the-better
stress and the ideal S/N ratio, which we desire to be as large as possible.
Figure 3 shows that increasing the melt temperature, holding pressure, and holding time increases stress. Increasing injection pressure will increase stress for the pressure range 1100-1500 psi but decrease the stress slightly beyond this range. Increasing mold temperature to 115ºF can make the strongest specimen as compared to other mold temperatures, but further mold temperature increases will lower stress. Results indicate that increasing cooling time from 15 to 25 seconds creates the best tensile strength; longer cooling times will decrease strength. Injection speed has a very slight effect on the tensile strength, since the two-level stress values are so close. The statistical analysis showed that holding pressure and melt temperature significantly affect tensile strength. The other factors were found to have no significant effect.
The optimal processing parameter settings from this Taguchi Parameter Design experiment can be determined from Figure 3. From each plot, the point with the highest value of both stress and S/N ratio is observed; then the factor level at this point is selected as the optimal level. Since there is no conflict found in Figure 3 between stress and S/N ratio, the optimal combination of all seven factors is A2-B3-C2-D1-E3-F2-G2. The final verification test will then be applied to confirm the success of this combination.
![]() Table
4. Modified L16 orthogonal array
Table
4. Modified L16 orthogonal array
|
Inner Control Factor Array |
Outer Noise Array |
|
|
||||||||
|
|
|
|
|
|
|
|
|
Temperature |
|
|
|
|
Run |
A |
B |
C |
D |
E |
F |
G |
65-70 F |
80-85 F |
|
|
|
|
|
|
|
|
|
|
|
Stress (PSI) |
Stress (PSI) |
Average |
S/N |
|
1 |
1 |
1 |
1 |
1 |
1 |
1 |
1 |
6074.0 |
6346.2 |
6210.1 |
75.8 |
|
2 |
1 |
2 |
2 |
1 |
2 |
2 |
2 |
6844.8 |
6742.7 |
6793.8 |
76.6 |
|
3 |
1 |
3 |
3 |
2 |
3 |
1 |
2 |
6727.4 |
6815.0 |
6771.2 |
76.6 |
|
4 |
1 |
4 |
4 |
2 |
4 |
2 |
1 |
6481.3 |
6633.9 |
6557.6 |
76.3 |
|
5 |
2 |
1 |
2 |
2 |
1 |
2 |
1 |
6787.5 |
6844.2 |
6815.8 |
76.7 |
|
6 |
2 |
2 |
1 |
2 |
2 |
1 |
2 |
6666.2 |
6741.4 |
6703.8 |
76.5 |
|
7 |
2 |
3 |
4 |
1 |
4 |
2 |
2 |
7317.1 |
7082.9 |
7200.0 |
77.1 |
|
8 |
2 |
4 |
3 |
1 |
3 |
1 |
1 |
6837.8 |
7130.2 |
6984.0 |
76.9 |
|
9 |
3 |
1 |
3 |
1 |
4 |
2 |
2 |
6780.8 |
6780.8 |
6780.8 |
76.6 |
|
10 |
3 |
2 |
4 |
1 |
3 |
1 |
1 |
6849.3 |
6846.4 |
6847.8 |
76.7 |
|
11 |
3 |
3 |
1 |
2 |
2 |
2 |
1 |
6887 |
7057.9 |
6972.5 |
76.9 |
|
12 |
3 |
4 |
2 |
2 |
1 |
1 |
2 |
6999.7 |
7191 |
7095.4 |
77 |
|
13 |
4 |
1 |
4 |
2 |
2 |
1 |
2 |
6390.3 |
6798.7 |
6594.5 |
76.4 |
|
14 |
4 |
2 |
3 |
2 |
1 |
2 |
1 |
6877.8 |
7030.4 |
6954.1 |
76.8 |
|
15 |
4 |
3 |
2 |
1 |
4 |
1 |
1 |
6528.3 |
7080.3 |
6804.3 |
76.6 |
|
16 |
4 |
4 |
1 |
1 |
3 |
2 |
2 |
7037.4 |
7106.1 |
7071.8 |
77 |
Table 5. F-test of noise-factor effect
|
Source |
DF |
Sum of Squares |
Mean Square |
F Ratio |
Prob > F |
|
Temperature |
1 |
143315.9 |
143316 |
2.1534 |
0.1527 |
|
Error |
30 |
1996644.9 |
66555 |
|
|
|
C. Total |
31 |
2139960.7 |
|
|
|
Table
6. Tensile strength ![]() (unit: psi)
effects
(unit: psi)
effects
|
|
Table 7. S/N ratio effects
|
|
Figure 3. Effects of control factors and S/N ratio
VERIFICATION
EXPERIMENT
In order to predict the influence of the control factors on the response in the Taguchi Parameter Design, this study employed the additive model. The additive model refers to the sum of the individual factor effects without interactions or cross-terms. Predicted values can be found by substituting appropriate values for factors in the equation. The applicability of the additive model cannot be shown simply from the factor effects plot. However, if the predictive equation is shown to successfully predict the results for different combinations of control factors, then it is evident that the additive equation applies and the interactions of control factors are low. This is the main purpose of the verification experiment.
The general form of the predictive equation is as follows:11
![]() , (2)
, (2)
where ![]() is the overall average
response (or S/N ratio) for the entire orthogonal array, and
is the overall average
response (or S/N ratio) for the entire orthogonal array, and ![]() are the response
averages for factor A, B, and C, respectively. The factor effects corresponding
to the modeled factor levels (typically the optimum levels) are used in the
predictive equation. The predicted stress value is 7342.5 psi using equation 2.
are the response
averages for factor A, B, and C, respectively. The factor effects corresponding
to the modeled factor levels (typically the optimum levels) are used in the
predictive equation. The predicted stress value is 7342.5 psi using equation 2.
The goal of the verification experiment is to confirm that the combination of the optimum control factors is valid, by demonstrating that the optimum parameter setting is predictable and reproducible. Therefore, if the verification result is similar to the predicted result, then the additive model is successful. Otherwise, if the verification test result is significantly different from the predicted result, then the model will have failed, likely due to the interactions among the control factors.
A total of twenty specimens were collected using the optimal combination of the control factors with a room temperature of 65-70oF, since room temperature does not appear to significantly affect results. The response variable used in the verification test was the tensile strength (stress) at peak σ.
Table 8 shows the results of the verification experiment,
including the individual value of stress σ, the overall average value of
stress σ (![]() ), overall standard deviation S, and 99% confidence intervals
for average stress value
), overall standard deviation S, and 99% confidence intervals
for average stress value ![]() . As shown in Table 7, the predicted stress value (7342.5
psi) falls within one standard deviation of the experimental means. Therefore,
it can be concluded with a 99% confidence that, by using the optimal
combination of the seven control factors, the verification test stress
measurement will range from 7177.4 psi to 7470.3 psi. Since the optimum
configuration gives a result close to the predicted result, the verification
test is considered successful. This shows that the prediction model is
successful and there are no significant interactions among the control factors.
The verification test shows the ability of the Taguchi Parameter Design to
predict the optimal conditions within the study range. The comparison between
the verification run and prediction from the optimal factor settings indicates
that the strongest tensile strength specimens can be effectively determined by
using the Taguchi Parameter Design.
. As shown in Table 7, the predicted stress value (7342.5
psi) falls within one standard deviation of the experimental means. Therefore,
it can be concluded with a 99% confidence that, by using the optimal
combination of the seven control factors, the verification test stress
measurement will range from 7177.4 psi to 7470.3 psi. Since the optimum
configuration gives a result close to the predicted result, the verification
test is considered successful. This shows that the prediction model is
successful and there are no significant interactions among the control factors.
The verification test shows the ability of the Taguchi Parameter Design to
predict the optimal conditions within the study range. The comparison between
the verification run and prediction from the optimal factor settings indicates
that the strongest tensile strength specimens can be effectively determined by
using the Taguchi Parameter Design.
Table 8. Verification test results
![]()
CONCLUSIONS
The Taguchi Parameter Design provides a very efficient and effective way to study the effects of inner control factors (processing parameters) and outer noise-factors (temperature) on the tensile strength of injection molded products. The Taguchi Parameter Design also provides a tool to determine optimal parameter settings for tensile strength.
Control factors such as holding pressure and melt temperature are the most significant factors affecting tensile strength. Other control factors had varying effects on the stress, but none of them was significant. The noise-factor, room temperature, was also found to have no significant effect.
The additive model works successfully for predicting the tensile strength behavior of GPS. The verification test results confirm that the optimal combination of processing parameter settings that were determined in this research can bring about the highest tensile strength samples and did so more than any other experimental combinations. The test results show the ability of the Taguchi Parameter Design to predict the optimal conditions within the study range.
The prediction developed in this study is an estimation of the tensile strength of GPS under the optimal injection molding parameter settings. This estimation has been found to be very reliable for this application, with significantly fewer tests in comparison to full factorial experimental designs. The Taguchi Parameter Design is therefore a tool not only for optimizing injection molding parameters during production but also for determining the predicted tensile strength of products during the design phase. This systematic approach is suggested to be able to be tailored to various products and materials for injection molding, for both the optimization of production and structural properties of injection molded plastic parts.
REFERENCES
[1] Woll, S.L.B., and D.J. Cooper, “Pattern-Based Closed-Loop Quality Control for the Injection Molding Process,” Polymer Engineering and Science, Vol. 37, No. 5, 1997, pp. 801-820.
[2] He, W., Zhang, Y.F., Lee, K.S., Fuh, J.Y.H., and A.Y.C. Nee, “Automated Process Parameter Resetting for Injection Molding: A Fuzzy-Neuro Approach,” Journal of Intelligent Manufacturing, Vol. 9, 1998, pp. 17-27.
[3] Fung, C.P., Hwang, J.R., and C.C. Hsu, “The Effect of Injection Molding Process Parameters on the Tensile Properties of Short Glass Fiber-Reinforced PBT,” Polymer-Plastics Technology and Engineering, Vol. 42, No. 1, 2003, pp. 45-63.
[4] Campbell, G.A., Campbell, S.E., Bullwinkel, M., Savoka, J., Ragona, L., and C. Mosier, “Effect of Oil Additives and Injection Molding Process Parameters on the Tensile and Impact Energy of Polypropylene,” Proceedings, 59th Annual Technical Conference of the Society of Plastics Engineers, Vol. 1, 2001, pp. 466-470.
[5] Chen, S.-C., Peng, H.-S., Huang, L.-T., and M.-S. Chung, “Investigations of the Tensile Properties on Polycarbonate Thin-Wall Injection Molded Parts,” Journal of Reinforced Plastics and Composites, Vol. 22, No. 5, 2003, pp. 479-494.
[6] Wu, J.L., Chen, S.J., and R. Malloy, “Development of an on-Line Cavity Pressure-Based Expert System for Injection Molding Process,” Proceedings from the Annual Technological Conference of the Society of Plastic Engineers, Vol. 49, 1991, pp. 444-449.
[7] Farrell, R.E., and L. Dzeskiewicz, “Expert System for Injection Molding,” Proceedings from the Annual Technological Conference of the Society of Plastic Engineers, Vol. 52, 1994, pp. 692-695.
[8] Choi, G.H., Lee, K.D., Chang, N., and S.G. Kim, “Optimization of Process Parameters of Injection Molding with Neural Network Application in a Process Simulation Environment,” Annals of the CIRP, Vol. 43, No. 1, 1994, pp. 449-452.
[9] He, W., Zhang, Y.F., and K.S. Lee, “Development of a Fuzzy-Neuro System for Parameter Resetting of Injection Molding,” Journal of Manufacturing Science and Engineering, Vol. 123, 2001, pp.110-118.
[10]
Ealey, L., Quality
by Design: Taguchi Methods and
[11]
Fowlkes, W.Y., and C.M. Creveling, Engineering Methods for Robust Product Design: Using Taguchi Methods in
Technology and Product Development,
[12] Vaeaetaeinen, O., Jaervelae, P., Valta, K., and P. Jaervelae, “The Effect of Processing Parameters on the Quality of Injection Molded Parts by Using the Taguchi Parameter Design Method,” Plastics, Rubber, and Composites Processing and Applications, Vol. 21, No. 4, 1994, pp. 211-217.
[13]
Viana, J.C.,
[14] Liu, S.-J., Wu, J.-Y., and J.-H. Chang, “Design of Experiments to Optimize the Weldline Strength in Injection Molded Thermoplastics,” Proceedings, 59th Annual Technical Conference of the Society of Plastics Engineers, Vol. 1, 2001, pp. 508-511.
[15]
Chang, T.C., and
[16] “Standard Test Method for Tensile Properties of Plastics,” Annual Book of ASTM Standards, Vol. 8.01, 2001, pp. 45-57.