
Volume 5, Number 1, Fall 2004
Ali Setoodehnia
Kean University
1000 Morris Avenue, Union, NJ USA
Hong Li
NYC College of Technology-CUNY
Mojtaba Shariat
Comcast Communication
Kamal Shahrabi
Ali Setoodehnia
Kean University
1000 Morris Avenue, Union, NJ USA
Hong Li
NYC College of Technology-CUNY
Mojtaba Shariat
Comcast Communication
Kamal Shahrabi
ABSTRACT
Voice over IP (VoIP)
has been studied for number of years and recently has been deployed on a field
trial basis in the cable IP network. VoIP is (or maybe “has been historically”)
perceived as an inexpensive service with “moderate” quality. As this service
becomes widely available however, the low-cost strategy will be augmented
with a differentiating Quality of Service (QoS) strategy as well as additional
security measures that may not have been implemented in early enterprise models.
This paper outlines a subset of access and network parameters influencing
voice call bandwidth utilization and grade of service over cable IP network.
In this paper, voice codec characteristics are quantified in terms of three parameters, bit rate, quality, and complexity. Applications of voice codecs are noted for services such as Instant Messaging (IM), Media Server (MS), and transcoding. Network performance is quantified in term of packet loss, latency, jitter, echo, and transcoding. We will attempt to quantify the effect of each parameter and outline proposed models for voice QoS. Emphasis has been placed on objective QoS models due to their application in tuning network elements for optimum performance. The analysis formulated in the paper will also serve as a guideline for deployment of QoS measurement and assessment in the cable IP network.
INTRODUCTION
Voice over IP (VoIP) has been studied for number of years and recently has
been deployed on a field trial basis in the Cable IP network. Important aspects
of the service include capabilities to support end-to-end Quality of Service
(QoS) and maintain optimum bandwidth utilization [4]. The term QoS applies
to many policies and resource management activities in the VoIP service architecture.
For example, a generic VoIP layered architecture would include: access node
(e.g. HFC), regional area network with IP/MPLS connectivity, VoIP office with
call control and signaling features, customer application domain, and resource
space for creation and management of services. At each layer, there are number
of parameters influencing QoS measure and assessment.
This paper describes a subset of parameters effecting bandwidth utilization
and QoS at access and network layers.
The selection of codecs depends on a number of
factors, such as the protocol employed, compatible codecs between endpoints,
network transcoding capability, and bandwidth availability and grant. If bandwidth were free, then a
high-resolution sampled voice could be deployed in any given call. However,
demand for bandwidth continues to drive optimization of applications and
deployment of efficient speech codecs in the network. Voice codecs are
typically deployed in terminal devices and possibly in edge devices. Deployment
of voice codecs in edge devices is intended to optimize bandwidth usage in the
managed IP network. Also, voice/speech
based enhanced services are an integral part of a MS in the IP network. Media
Server services include unified messaging, voicemail, conferencing, Interactive
Voice Response (IVR), speech recognition and text-to-speech. For applications
such as these, which require voice codecs in the network equipment, low bit
rate codecs are recommended.
Voice codec characteristics
have been quantified in terms of three parameters, bit rate, quality, and
complexity. [5]Considering various packet overheads and codecs, a simple calculation
is performed to evaluate the effective bit rate of IP packets in the cable
network. Network performance has been
quantified in term of packet loss, latency, jitter, echo, and transcoding.
In this paper, we evaluate the effect of each parameter and outline objective
models for voice QoS based on a given parameter’s measurement. The objective
of this study is multifaceted. The information in the document will make recommendations
to aid network performance modeling projects, serve as an engineering guideline
for voice services planning/provisioning, and the measure of QoS would be
used to tune network elements for optimum performance.
During the last ten years, a number of voice
codecs have been developed and deployed in Circuit Switched (CS), wireless
networks and Voice Messaging (VM) services. Table 1 identifies a number of
voice/speech codecs that we believe are candidates for voice services in the
cable IP network. More advanced
compression algorithms have produced low bit rate codecs requiring less
transmission bandwidth, however, there are a number of performance factors to
consider. These are:
·
Large frame size (sampled voice) will be
needed by the more advanced compression algorithms
·
There is a look ahead time, which is
needed for decoding or de-compression
·
As a result of the above, additional
codec delay (end-to-end delay) will be produced.
·
Compression is not lossless, thus perceived
voice quality will be compromised by more compression.
In
conjunction with codecs, Voice Activity Detection (VAD) and Comfort Noise
Generation (CNG) are features, which further reduce the average bit rate of
transmission during silence periods. [5]
Voice code complexity directly translates to the
cost of implementation. Another factor influencing the overall cost of codecs
includes licensing charges (if any). Their inventors patent most codecs, therefore
MTA manufacturers may need to pay royalties for the use of codecs in their
equipment. The current G.711 however is royalty free, which is a major factor
in the decision to launch initial deployments with this codec. Table 1 below
summarizes commonly used codecs in wired and wireless applications. Dark blue entries in Table 2 indicate codecs
that are recommended by the CableLabs for implementation in the devices in
cable IP networks, which include PCM (Pulse Code Modulation), ADPCM (Adaptive
Differential Pulse Code Modulation), LD-CELP (Low Delay Code Excited Linear
Prediction), CS-ACELP (Conjugate Structure Algebraic CELP), CS-ACELP (Conjugate
Structure Algebraic CELP), MP-MLQ (Multi-Pulse Maximum Likelihood Quantization)
&ACELP (Algebraic Code Excited Linear Prediction)
Table 1: Voice Codec Parameters
|
Coding Standard |
Algorithm |
Data Rate, Kbps |
Frame Size, msec |
Look Ahead, msec |
Codec Delay, msec |
|
G.711 |
PCM |
64 |
0.125 |
0 |
0.25 |
|
G.726 |
ADPCM |
16, 24, 32, 40 |
0.125 |
0 |
0.25 |
|
G.728 |
LD-CELP |
16 |
0.625 |
0 |
1.25 |
|
G.729e |
CS-ACELP |
11.8 |
10 |
5 |
25 |
|
G.729 |
CS-ACELP |
8 |
10 |
5 |
25 |
|
G.723.1 |
MP-MLQ |
6.3, 5.3 |
30 |
7.5 |
67.5 |
NETWORK PERFORMANCE CHARACTERISTICS
In cable IP networks,
analog voice is sampled, packetized, serialized, and transported over the
Hybrid Fiber Coax (HFC), Regional Area Network (RAN), and gated to a party
on the Public Switched Telephone Network (PSTN), or a party on the IP network.
As a result, there are number of network parameters that affect voice quality,
some of which are described here, including effective bit rate, delay, echo,
and packet loss. The end-to-end service
quality in cable IP networks include other parameters (e.g. piggybacking,
concatenation, etc.) and features (e.g. Best Effort, UGS), which will be studied
in the future releases of the document.
As
noted previously, voice samples are encapsulated into an IP packet having
overheads from various layers of protocol as shown in Figure 1. The number of bits in the DOCSIS physical
(PHY) layer’s overhead is not specified, because the actual number depends on
number of parameters and conditions. These parameters and conditions also will
be explained briefly in this section.
Also in Figure 1, the RTP header does not include Contributing Source
(CSRC) identifier.[1] It is assumed only one stream (a voice call) is
included in the RTP transport protocol.
|
DOCSIS PHY |
DOCSIS MAC (14) |
ETH (14) |
IP (20) |
UDP (8) |
RTP (12) |
Payload (Variable size compressed samples) |
FCS (4) |
Figure 1 – A Pictorial representation of IP packet
payload + headers
During a call, most of the overheads shown in
Figure 1 are redundant from one packet to the next and may be suppressed to
optimize bandwidth usage. This is known as Payload Header Suppression (PHS),
which is listed as an “option” in the current DOCSIS 1.1 specification. [6] At
the link layer, CM and CMTS negotiate through DOCSIS protocol to perform PHS
both on the upstream and downstream during a call. Figure 2 is the pictorial
representation of overheads with PHS enabled. Note that the PHS is transparent
to the network, since CMTSs reconstruct the original header prior to forwarding
to the RAN.
|
DOCSIS PHY |
DOCSIS MAC (14) |
ETH (0) |
IP (0) |
UDP (0) |
RTP (12) |
Payload (Variable size compressed samples) |
FCS (4) |
Figure 2 – A Pictorial representation of IP packet
payload with PHS
Tables
2 & 3 below provide the effective bit rates of various codecs without &
with considering PHS, however, the DOCSIS Physical layer overheads are not
considered in the calculation. The
effective bit rate is calculated by taking into account headers (as shown in
the Figure 1&2) in a frame plus the codec’s bit rate, and producing a
number in terms of bits per second (bps).
Note
that the 14-bytes DOCSIS headers shown in Figure 1 are for upstream, which
include, 6 bytes of base header, 3 bytes of extended UGS header, 5 bytes
of extended BPI+ header. Dark blue
columns in Table 2 indicate codecs that are recommended by CableLabs.
Table 2: Effective bit rate of IP packets with different
voice codecs without PHS
|
Packet size, ms |
Effective
bit rate (using G.711) bps |
Effective
bit rate (using G.728) bps |
Effective
bit rate (using G.729e) bps |
Effective bit
rate (using G.729) bps |
Effective bit
rate (using G.723.1) bps |
|
10 |
121600 |
73600 |
69400 |
65600 |
62900 |
|
20 |
92800 |
44800 |
40600 |
36800 |
34100 |
|
30 |
83200 |
35200 |
31000 |
27200 |
24500 |
Table 3: Effective bit rate of IP packets with different
voice codecs with PHS
|
Packet size, ms |
Effective
bit rate (using G.711) bps |
Effective
bit rate (using G.728) bps |
Effective
bit rate (using G.729e) bps |
Effective bit
rate (using G.729) bps |
Effective bit
rate (using G.723.1) bps |
|
10 |
88000 |
40000 |
35800 |
32000 |
29300 |
|
20 |
76000 |
28000 |
23800 |
20000 |
17300 |
|
30 |
72000 |
24000 |
19800 |
16000 |
13300 |
PACKET LOSS
There
are number of parameters contributing to packet loss, including network congestion
or data corruption. Packet loss affects fidelity of voice quality and in most
codecs more than 3% packet loss results in an unacceptable grade of service.
Studies of voice grade of service in the
context of PSTN (ITU-T Recommendation P.800) have produced a Mean Opinion Score
(MOS) for toll (acceptable) quality at level 4 on a scale of 5. Thus QoS
comparisons are made based on this measurement. A 3% packet loss rate results,
on average, in a reduction in MOS scores of 0.5 point.
Interpolation is one approach to compensate for
lost packets. The speech/voice decoder will predict what the missing packet
(payload) should be based on the previous packet. This technique is known
as Packet Loss Concealment (PLC). All codecs mentioned in this document have
PLC algorithms built into their standards. The improvement trade-off is that
latency resulting from PLC processing and the interpolation process may produce
an audible artifact.
LATENCY
The
end-to-end latency of a voice call over a cable IP network results from cumulative
effect of algorithmic, packetization, serialization, propagation, and component
delays. A simple problem arising from delay is called “talker overlap”. This
happens when large gaps (delays) exist between received signals; thus encouraging
the other party to speak (thinking the first talker has stopped). Given below,
is a summary of delays in sequential order.
Control of overall latency requires a hand-in-hand
effort by system resources and the VoIP application. ITU-T recommendation
(G.114) defines a maximum end-to-end delay of 150 milliseconds. Typical end-to-end
delays in IP networks range from 50 to 300 milliseconds.
DELAY VARIATION (JITTER)
IP
networks have been optimized for reliable data transmission, thus allowing
for a variation in delays across different packets in a transmission. Even
though a source gateway generates voice packets at regular intervals (say,
every 20 ms), a destination gateway will typically not receive these packets
at regular intervals due to jitter. In order to correct for this, data needs
to be stored in a buffer with a dynamic size, to allow for slowest packets
to arrive and put into order. The ordering process contributes to end-to-end
delay.
ECHO
When a transmitted signal is returned at
some late time, usually at much lower power levels, echoes are produced in
a transmitters’ ear. There are at least
two common types of echoes in the wired communication. “Acoustic echo”, typically
results from poor electro-acoustic coupling between earpiece and mouthpiece
in the handset. “Hybrid echo”, typically results from the impedance mismatches
in the 2-4 wire conversion processes along the PSTN network.
The degree to which echo is objectionable
depends on echo loudness (level of returned signal power), measured in dB, and
total delay (as explained above), measured in milliseconds. For example, if the returned signal power
were very small (20 dB below the power of the transmitted signal), even with a
large delay it would not be noticeable.
The same analogy holds true for short round
trip delay, typically below 50 milliseconds. The ITU’s generalized recommendation is that
connections with one-way delay greater than 25 msec should have echo control
devices. Echo cancellers are the preferred and most commonly deployed mechanism,
which is typically located as near to the source of the echo as possible.
TRANSCODING
Transcoding is a mechanism to convert between
incompatible voice codecs, e.g. converting between G.711 and G.728 at an edge
device. The transcoding process requires resources (MIPS & Memory) as
well as adding additional latency into the connection. Codecs are not lossless,
thus any transcoding results in a degradation of voice quality.
VOICE
CODEC QOS MEASURES IN CABLE IP NETWORKS
There are two well-known and established
measures of voice quality of service, namely subjective and objective models.
Mean Opinion Score (MOS) ratings are a subjective measurement that has been
developed by the ITU to characterize grade of service as well as aid in the
development of objective models.
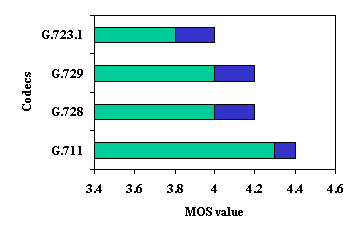
Figure
3: MOS for Voice Codecs
ITU-T P.800 MOS is a widely known standard for
measure of voice quality. The model
ranks voice quality based on 5-point scale. Using this scale, an average score
of 4 and above is considered as toll-quality. Figure 3 depicts MOS for
different voice coding algorithms. The dark blue color area means the
rating for that codec is within that range. For example, G.711 is rated between
4.3 and 4.4. Under ideal network conditions, with the exception of G.723.1,
other codecs are rated above 4, i.e. their quality meet or exceed toll grade
requirements.
MOS subjective measurement is most salient since it is based
on human opinion of grade of services. However, it may not be an economical and
practical method of measurement as an ongoing process, since it involves human
subject sampling on a large and geographically dispersed scale.
Often, limited MOS testing results are correlated with well-known mathematical objective models to assess quality. Most notable objective models include, Perceived Speech Quality Measure (PSQM, ITU-T P.861), Perceptual Evaluation of Speech Quality (PESQ, ITU P.862), and E-models (ITU-T G.107). [2-4] - The E-model, described in ITU-T G.107 is derived from an equivalent model that has been deployed in the assessment of voice quality in the PSTN. The E-model results in a transmission-rating factor, R, calculated from following equation:
R = Ro - Is - Id - Ie + A, where
R is the Transmission Rating Factor
Ro is the basic signal to noise ratio based on send, receive loudness, electrical and background noise
Is represents the sum of real-time voice transmission impairments, for example, loudness, sidetone, and PCM quantizing distortion
Id represents the sum of delayed impairments relative to the voice signal, for example, talker echo, listener echo, and absolute delay
Ie represents the Equipment Impairment factor for special equipment, for example, low bit-rate coding (determined subjectively for each CODEC, for each percentage of packet loss)
A is the Advantage factor (compensates for advantage of access, for example, satellite phone)
The
transmission rating factor R takes on value from 0 to 100, with R=100
representing very high quality. The R-value is related to MOS value through
following rule:
For R < 0 MOS = 1
For 0 < R < 100 MOS = 1+ 0.035R + R(R-60)(100-R)7x10^-6
For R > 100 MOS = 4.5
For
example, R=80 is equivalent of MOS of 4.03. Provisional guide for relating
R-value [3] to user satisfaction is shown in Table 4.
Table 4: Relation Between user satisfaction and R-value
|
R-Value |
MOS calculated
from R |
User
Satisfaction |
|
90 |
4.34 |
Very Satisfied |
|
80 |
4.03 |
Satisfied |
|
70 |
3.6 |
Some users dissatisfied |
|
60 |
3.1 |
Many users dissatisfied |
|
50 |
2.58 |
Nearly all users dissatisfied |
SUMMARY
This
paper has reviewed three fundamental aspects of voice quality of service in
the cable IP network. The first of which include voice codecs parameters,
such as compression rate, processing delay, and look ahead period. The second
aspect of voice quality of service is influenced by network parameters such
as bandwidth, delay, echo, and transcoding. The third aspect includes incorporating
these parameters into either a subjective and/or objective measure to assess
performance and obtain an MOS model for voice quality of service in the cable
IP network.
[1]
H. Schulzrinne,
[2]
ITU-T Recommendation P.862 (2001), Perceptual
Evaluation of Speech Quality (PESQ): An objective method for end-to-end speech
quality assessment of narrowband telephone networks and speech codecs.
[3]
ITU-T Recommendation G.107 (5/2000), The
E-Model, a computational model for use in transmission planning.
[4]
ITU-T Recommendation P.861 (2/1998), Objective
quality measurement of telephone-band (300-3400 Hz) speech codecs.
[5]
PacketCable™ Audio/Video Codecs Specification,
PKT-SP-CODEC-I04-021018,
[6] Data-Over-Cable Service Interface Specifications, DOCSIS 1.1, Radio Frequency Interface Specification, cableLabs, SP-RFIv1.1-I10-030730