
Volume 6, Number 1, Fall
2005
Design and Development of a
Cost Effective Data Acquisition System Using PC’s Parallel Port
Abul K. M. Azad
Department of
Technology,
Northern
azad@ceet.niu.edu
Abstract
This paper describes
the design and development of a low-cost computer interfacing system. The system can be used between a PC and an
engineering system for data acquisition and control. The main features of the designed system are
low-cost, simple operation, flexible accommodation of various data acquisition
and control needs, and adaptability with Internet-based applications. To implement these concepts, the developed
system has the following features: a) interface ability with a PC through its
standard parallel port, b) ability to accept and provide various types of
inputs/outputs (analog and digital) with minimum hardware, c) user-friendly
graphical user interface (GUI) to monitor and control a data transfer between a
PC and an engineering system, and d) future extension capabilities through
maximizing the use of software in the development.
Introduction
The author and his
co-workers conducted a project towards the design and development of an
Internet-based physical laboratory facility.
The project has successfully shown that there is significant potential
for an Internet-based physical laboratory facility for educational, industrial,
and manufacturing fields.1, 2, 3
The benefits and effectiveness of the Internet-based laboratory facility
have also been highlighted by a number of other researchers.4, 5, 6, 7
Within the
developed facility, a commercially available Input/Output (I/O) card was used
inside a PC to act as a gateway between the experiment and the PC. The use of
commercially available I/O cards poses several drawbacks. These are
a) Cost: I/O cards are
relatively expensive, and their use requires additional cable and connection
boxes, which are expensive as well.
Considering the need for one I/O card for each experiment, the total
cost to set-up an Internet-based laboratory facility for a class would be quite
high.
b) Complex installation and
operation: Installation
of this I/O card needs access inside the PC along with the installation of a
suitable software driver. In some cases,
the installation needs expert help, as sometimes this task is beyond the scope
of a faculty and/or a student. All these
increase set-up time and also subsequent changes or modifications.
The above problems
hinder the wider use of an Internet-based laboratory facility as a part of a
regular academic laboratory course. To
overcome these problems, last summer, the author was awarded a project funded
by the Omron Electronics Foundation through the
This paper reports the design and
development of a computer interfacing system.
The system can be used as a stand-alone computer data acquisition and
control as well as a low-cost and simple alternative of an I/O card towards the
development of affordable Internet-based physical laboratory facilities. The designed system uses a computer’s
parallel port for its communication and provides a low-cost and effective means
of computer interfacing. After this
introduction, the first section describes the hardware and software
system. The second section compares the
developed system with the commercially available products along with a cost
analysis. These are followed by the
conclusion and a list of references.
System Description
The reported system has three main
components. These are hardware,
software, and GUI. The hardware part of this
project provides an electronic platform for transferring data between a PC and
an experiment through a PC’s parallel port, while the software provides a means
of controlling the data flow between a PC and an engineering system. The GUI provides the user with a tool for
adjusting various data acquisition parameters as well as monitoring the signal
waveform, which is being transferred.
Hardware
The hardware
system provides an interface between a PC and an engineering system through a
PC’s parallel port. A block diagram of
the hardware system is shown in Figure 1.
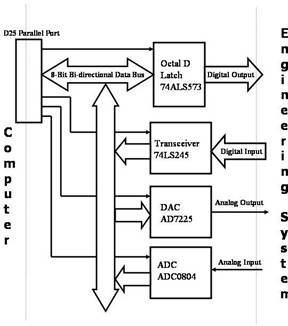
Figure 1: Block diagram of the hardware system
The left hand side
of the diagram is the host computer, which is to be used for data acquisition
and control while the right hand side of the diagram is the engineering system,
which needs to be controlled or from where data needs to be transferred (both
directions).
The system is
capable of handling digital and analog data for bi-directional transfers. In this way, one can send data from a PC to
operate an experiment or receive data from an experiment and subsequently store
them in a PC for further analysis.
Either a serial or
a parallel port of the PC could be used as the interfacing port. The parallel port was chosen, as this can
provide a means of transferring data in a parallel manner and hence facilitate
relatively high speed data transfer. The
hardware part of the developed system can be divided into three components:
digital data, analog data, and control signals.
a)
Digital
data: For the digital part,
there are two main tasks. One is to
provide a means of co-ordination in data transfer between a PC’s parallel port
and the experiment under consideration.
The second is to provide a buffer to safeguard the PC’s internal
hardware system. 8
b)
Analog
data: This system deals with
converting data from analog to digital (ADC) during the data acquisition
process and converting from digital to analog (DAC) while providing analog
output to an engineering system. The
hardware is designed to accept multiple inputs and outputs. The user can also change the data transfer
rate between a PC and an engineering system through the developed GUI.
c)
Control
signals: To keep track of
all these data transfers between a PC and an engineering system, there are some
control signals that need to be provided in a timely manner. The control signals are produced internal to
a PC in co-ordination with a user’s request through the GUI. 9
The outline of the parallel port interface circuit is given in Figure 1. The circuit consists of four main ICs. The functions of these ICs are described below:
74ALS573: Transparent Octal D-latch provides an 8-bit digital output. The outputs can be passed to an experiment as well as to a bank of LEDs for monitoring purposes. The Latch Enable pin of this chip is connected to the control port (bit-C0). This device is selected when the bit-C0 goes high, and the latch is disabled when the bit-C0 is low.
74LS245: Octal bi-directional transceiver provides an 8-bit digital input. This can be connected to a bank of status (digital) switches or any other device that can produce digital data. The pin Output Enable is connected to the bit-C1 of the control port. This device is enabled when the bit-C1 is low and disabled when the bit-C1 is high.
AD7225: DAC is used for providing analog output from a digital data stream provided from a PC. It consists of four 8-bit DAC with an output buffer amplifier. This DAC requires a reference voltage input. The output is taken from a particular channel depending upon the value of the address inputs. The control pin (bit-C3) of control port is connected to the /WR pin of this device. The conversion is done when the bit-C3 is low and is stopped when the bit-C3 is high.
ADC0804: 8- bit ADC is used to convert an analog output from an experiment to the digital while transferring this from an experiment to a PC. The conversion depends upon the read signal, which is being altered from one of the control lines of the parallel port to initiate the conversion process.
The parallel port has an 8-bit data bus, which is
connected to the PC’s internal data bus.
The
Table-1:
Bit status of the control port for various operations.
|
Operation |
C5 |
C4 |
/C3 |
C2 |
/C1 |
/C0 |
|
Output Digital Data (74ALS573) |
0 |
0 |
0 |
1 |
0 |
0 |
|
Input Digital Data (74LS245) |
1 |
0 |
0 |
1 |
1 |
1 |
|
Analog Output (through DAC) |
0 |
0 |
1 |
1 |
0 |
1 |
|
Analog Input (through ADC) |
1 |
0 |
0 |
0 |
0 |
1 |
Depending upon the function performed by different
command buttons within the GUI, the 8-bit data lines can be used as bi-directional
to transfer data between a PC and an experiment. A particular input or output can be selected
by placing specific values in the control register. Although the electronic components used are
capable of handling multiple inputs or outputs, their connection configuration
allows only one input or output signal to be active at any point in time. However, by using a suitable multiplexer
system, the capability of this system can be extended.
The parallel port of a PC is a 25-pin D-shaped female connector and is normally used for connecting a PC to a printer. It had a total of 12 digital outputs and 5 digital inputs accessed via three consecutive 8-bit ports in the processors’ I/O space. Eight output pins are accessed via the data port, 5 input pins are accessed via the status port, 4 output pins are accessed via the control port, and the remaining 8 pins are connected to the ground. Various enhanced versions of this parallel port have been introduced over the years: a) PS/2 (Bi-directional), b) enhanced parallel port, and c) extended capabilities port.
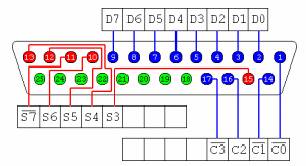
Figure 2: Pin configuration of a 25-pin D-shaped
connector
The original specification for the printer port allows data flow only in one direction. These enhanced versions of the printer port allow bi-directional transfer of data, yielding data acquisition and control through a printer port. The pin diagram and description of a 25-pin D-shaped connector are given in Figure 2.
The parallel port contains 8 data output pins (D0 through D7), 5 status input pins (S3 through S7), and 4 output control pins (C0 through C3). The pins with a bar on top are designated as active low. The detail description of each of these pins is given in Table-2. A - Indicates inverted logic, when + Indicates a positive logic.
Table-2: Specification of a 25-pin D-shaped
connector pins.
|
DB25 |
Sign |
Registration |
Type |
Asset |
Sense |
|
1 |
Control 0 |
C0 - |
Output |
Low |
Inverted |
|
2 |
Data 0 |
D0 |
Output |
High |
Direct |
|
3 |
Data 1 |
D1 |
Output |
High |
Direct |
|
4 |
Data 2 |
D2 |
Output |
High |
Direct |
|
5 |
Data 3 |
D3 |
Output |
High |
Direct |
|
6 |
Data 4 |
D4 |
Output |
High |
Direct |
|
7 |
Data 5 |
D5 |
Output |
High |
Direct |
|
8 |
Data a 6 |
D6 |
Output |
High |
Direct |
|
9 |
Data 7 |
D7 |
Output |
High |
Direct |
|
10 |
Status 6 |
S6+ |
Input |
High |
Direct |
|
11 |
Status 7 |
S7 - |
Input |
Low |
Inverted |
|
12 |
Status 5 |
S5+ |
Input |
High |
Direct |
|
13 |
Status 4 |
S4+ |
Input |
High |
Direct |
|
14 |
Control 1 |
C1 - |
Output |
Low |
Inverted |
|
15 |
Status 3 |
S3+ |
Input |
High |
Direct |
|
16 |
Control 2 |
C2+ |
Output |
High |
Direct |
|
17 |
Control 3 |
C3 - |
Output |
Low |
Inverted |
|
18-25 |
Ground |
- |
- |
- |
- |
There are three registers associated with every parallel port: a) data register, b) control register, and c) status register. Each of these registers is accessed with a specific address. The address allocation to each of these ports is as follows:
a) Data register: This register is 8-bits in size and can be addressed using the base address of the parallel port. The base address is either 3BC(hex) or 378(hex) depending upon which parallel port is in use.
b) Status register: It is an important register that is used to gather information from the peripheral device connected with the parallel port. The address for the status register is base address + 1 [3BC(hex) + 1 or 378(hex) + 1]. Only the five most significant bits are used from this address location.
c) Control register: The address for this register is base address + 2 [3BC(hex) + 2 or 378(hex) + 2]. It is used to control various functions of the peripheral connected with this parallel port. Only the four least significant bits from this address are used as a control register.
Software Usage
There is a number
of available high level software or software packages that can be used for the
purpose of this development. These are
C++, Java, Visual Basic, Matlab, and LabVIEW.
Considering the short development time, interface capability with future
web application, and targeted features for the GUI design, Visual Basic was
identified as the software tool for this project.10, 11 The developed software was used to access the
PC’s parallel port registers and can perform the following:
a) Collect incoming data (digital or analog)
stream and store them to a file on the PC’s hard disk;
b) Deliver a pre-programmed outgoing data
(digital or analog) stream from a file;
c) Provide control signals to perform the data transfer
task in a coordinated manner.
The software used for this
development has two specific purposes.
One is to develop a GUI as a front end for the user, and the other is to
perform the entire data collection and manipulation task as commanded by the
user through the GUI. A description of
the GUI will provide the capabilities of the system.
Graphical User Interface (GUI)
The GUI provides
the user with a means of controlling the data transfer process between a PC and
an engineering system. The front panel
of the GUI is shown in Figure 3. The
functionalities within the GUI are divided into three groups. The first one is for digital I/O, the second
one is for analog I/O, and the third one is the option buttons used to adjust
the graph display properties and the sampling rate. A figure window within the GUI (bottom right
corner) is used to display the analog and digital signals during a data
transfer process.
All the buttons
within the GUI are divided into two groups.
One is the command button group, and the other is the option button
group. The option buttons allow the user
to adjust certain properties of the GUI along with the sampling rate and choice
of panel color while the command buttons are used to perform a specific
operation.
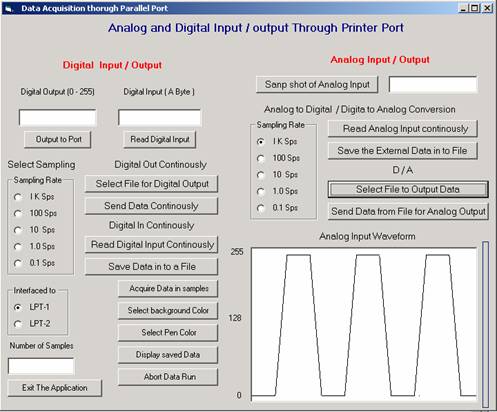
Figure 3: The GUI
front panel.
Digital
Input/Output
The data transfer between a PC and an engineering system could be a
single value or a continuous data stream.
Single value to
output: For a single value output of 8-bit digital data,
the user needs to provide a decimal number (equivalent of a binary number) and
click on the “Output to Port” button.
This command button sends a specific binary value to the data register
as requested by the user. The data
register is 8-bit in size, and the range of the value can be from 0 to
255. The requested binary value can be
visually displayed through 8 LEDs connected with the data lines of the parallel
port.
Single value to
collect: For this operation, the user needs to click
on the “Read Digital Input” button.
This button reads a single digital byte and transfers the value to the
input register of the parallel port. The
collected data value will be subsequently displayed in a message box just above
the button. The data read could be the
status of a bank of switches or any other part of the engineering system that
produces a digital output.
Continuous
output: This function is
used to transfer a stream of 8-bit data from a PC to an experiment. The first step of this is to click on the “Select File for Digital Output” button. Upon activating, it
pops up a window for the user to select a pre-fabricated file with digital data
profile. After selecting a file, the
user needs to click on the “Send Data
Continuously” button. The data will then be passed to the
experiment through the interface hardware.
Continuous
input: This function reads digital data from an
experiment and stores them on a PC’s RAM at an interval determined by the
sampling rate. Various messages will be
popped out to inform the starting and end of a data acquisition process. A click on the “Read Digital Data Continuously” button will start the process.
A window will pop up to enter a file name. The data collected in this process will be
stored on this file for further analysis.
Analog
Input/Output
Single value to
collect: This operation reads a particular sample of
an analog signal through the ADC and places the value on a message window
around the top right corner of the GUI.
The command button for this operation is “Snap shot
of Analog Input.”
Continuous
output: This operation allows the system to deliver a
stream of analog data continuously from a PC.
The DAC comes into play for this operation. To initiate the process, the user needs to
click on the command button called “Select
File to Output Data.” Upon activating, it will pop up a window to
select a file from the PC’s hard disk.
This selected file must contain a series of data samples. Upon selecting a file, the entire data file
will be transferred to the PC’s RAM. To
complete the data transfer, the user needs to click on the command button
called “Send Data from file for Analog Output.”
Continuous
input: The analog input waveform applied to the ADC
will be sampled, and the 8-bit digital value will be read into the data
register of the parallel port. To
initiate the process, a user needs to click on the “Read Analog Input Continuously” command button. Various
messages will be popped out, informing the beginning and end of a data acquisition
process. The collected data will be
stored temporarily on the PC’s RAM to facilitate high speed data transfer. To save these data on a file, the user needs
to click on “Save the External Data into a File” button.
The user will then have an option to choose a file name and location,
where the collected data will be stored.
Option
Buttons
In addition to the digital and analog data transfer, the developed
interfacing system performs certain additional operations, which are described
in this section.
Acquire
specific amount of samples:
This command button is similar to the “Read
Analog Input Continuously” but
for a specific amount of samples. By
clicking this button, a window will pop out, where the user needs to enter the
number of samples (Figure 4). During
this operation, a pixel will be placed in the graph window area of the GUI
according the value of each data point.
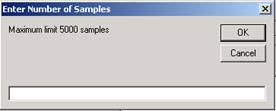
Figure 4:
Sample number selection window.
Select
background color: A color palette window will pop out when a
user clicks on this button. The selected
color within the color palette will be set as the background color for the
picture part of the GUI.
Select pen
color: Activating this button will bring up the
color palette. The selected color is set as the pixel color pointed on the
picture part of the GUI.
Display saved
data: This command button, when activated, opens a
window to select a file name. The data
stored within the selected file will then be displayed in the display area of
the GUI.
Abort data run
and exit the application: This button is used to suspend a data
transfer process and will return the control to the GUI.
Interfaced to
LPT1 or LPT2: This option provides a choice to connect the
external circuitry to one of the two available printer ports.
Sampling rate: With
this option, a user can control the data transfer rate between a PC and an
engineering system by activating the appropriate radio button. The available sample rates are: 1000, 100,
10, 1, and 0.1 samples per second.
COMPARISON and COST ANALYSIS
One of the main
objectives of this project was to develop a cost effective interfacing system,
which can be used for Internet-based physical laboratory experiments as well as
a stand alone data acquisition system.
In addition to this, the system is developed with minimum hardware, and
most of the tasks are shifted within the software. This provides higher flexibility in terms of
user options and any future expansion.
The minimum hardware and software requirement is a PC with Pentium II
processor, 256MB of RAM, printer parallel port, and Visual Basic.
There is a range
of commercial products that are using computers’ PCI slot, parallel port, or
USB port for their interface system. At
the lower end, the price of these products is in the range of $100. In addition to these, one needs to acquire
the custom software package or develop their own software, using a suitable
high level language. The proposed
product cost is about $20, which includes hardware and software, and the cost
can be reduced further through mass production.
The software used for this project is Visual Basic and is usually
available within an engineering and engineering technology education
environment.
Conclusions
Design and development of a user
friendly low-cost data acquisition system have been presented. The system can easily be integrated with a PC
for data collection and control of an engineering system. The system has very little hardware and major
software components, which will ensure the user flexibility in data transfer
and future modification and/or upgrading.
A number of user-driven facilities have been incorporated within the
developed system so that the data can be transferred bi-directionally with
various options.
The developed hardware has three
components. These are a) digital data,
b) analog data, and c) control signals.
The digital data part is used to facilitate a buffer between a PC and an
experiment for digital data transfer while the analog data part provides a
means of converting an analog data to digital for a data collection process and
vice versa. The control signals are to
provide appropriate logic levels to the digital and analog parts of the system
and also facilitate co-ordination towards performing a desired data transfer
operation. Through the GUI, the user
initiates the generation of control signals by a PC’s hardware system.
The software part of this system
has two components. One is the GUI,
through which a user can choose a particular option and control the transfer
process for a given data transfer task.
The other part is the underlying code, which performs all the data
manipulation, storage and extraction of data, and the initiation of control
signals as instructed by a user. For
Internet friendliness and flexibility in design, Visual Basic is used for the
development of this GUI.
ACKNOWLEDGEMENT
The author expresses his gratitude to Omron Electronics
Foundation for funding this work. Also
thanks to Dr. Promod Vohra, Dean of
the
REFERENCES
[1] Azad, A. K. M., Otieno,
A., Ghrayeb, O. and Anand, N. (2003).
Internet Based Experiments for Physical Laboratory Set-up, ASEE
Annual Conference & Exposition (Information Systems Division),
[2] Ghrayeb, O., Azad, A. K. M., and Otieno, A. (2003). Internet Based Approach to Develop Remote Tool Monitoring System, 2003 Industrial Engineering Research Conference, Hilton Portland, Portland, Oregon, May 18 – 20.
[3] Azad, A. K. M., Otieno, and Ghrayeb, O. (2003).
Internet-Assisted Physical Laboratory Facility: Potential for Laboratory
Teaching and Industry Applications, International Journal of Engineering
Education (submitted).
[4] Mott, R.
L., Neff, G.P., Stratton, M.J., and Summers, D.C.S. (2002). Future
Directions for Mechanical Manufacturing, and Industrial Engineering Technology
Programs, Journal of Engineering
Technology, 19(1), pp.8-15.
[5] Machine
Vision Association of the Society of Manufacturing Engineers. 2000 Machine Vision Industry Trends Report,
2000. Available:
www.sme.org/cgi-bin/membhtml.pl?/mva/ 00mvatrends.htm&&&SME&>.
[6] Poindexter,
S. E. and Heck, B. S. (1991). Using the web in your courses: What can you
do? What should you do?, IEEE
Control Systems Magazine, 19,
pp.83-92.
[7] Catlin, A. C., et al., The SoftLAB experience: Building virtual laboratories for computational science, Available: http://www.cs.purdue.edu/research/cse/softlab /softlab-vlabs/softlab-framework/softlab_report/report.html, the site has last viewed on Monday, 13th of October 2003.
[8] Interfacing
to the
[9]
[10] Engdahl, T. (2000). How to use PC parallel port output, http://www.hut.fi/Misc/ Electronics/circuits/parallel output.html, and the site has last viewed on Monday, 13th of October 2003.
[11] Upper Canada Technologies, IOPORT and NTPORT for I/O hardware
access, www.uct.on.ca, and the site has last viewed on Monday, 13th
of October 2003.
BIOGRAPHICAL
INFORMATION
Abul K. M. Azad is an Assistant
Professor with the Department of Technology of