
Volume 6,
Number 1, Fall 2005
Detection and Analysis of Explosive's THz Spectra
Ali Setoodehnia, Feng Huang, Kamal Shahrabi
Technology
Department,
Hong Li
Abstract
Neural network, a nonlinear mathematical
approximation model, has demonstrated wide applications for classifying various
lethal substances using far infrared spectral features and Terahertz Time
Domain Spectroscopy (THz-TDS). It provides the optical response of a medium in
both amplitude and phase. This paper presents research on an application of
neural network, which leads to a detailed analysis of optical properties of
explosive materials. This process is
normally complicated due to the complication of system and multiple effects
involved. The research result can be applied in applications for standoff
detection of the presence of explosive materials. We proposed a match filter
for detection of such material in the first stage. A further investigation using
neural network will be discussed.
Introduction
Due to the
growing challenge of international security, many methods have been developed
to monitor, detect, and characterize hidden lethal agents, such as plastic
explosives strapped to a person or a bioagent in envelopes. Terahertz radiation 1-3 spans the
far infrared range with wavelengths ~ 0.3 mm. It typically transmits through
plastics, paper products, etc. and may be useful for probing inside of
clothing, luggage, and parcels. THz pulse spectroscopy was used to study the
polymorph crystalline structures of the antihistamine drug ranitidine
hydrochloride.4 Several
common energetic (explosive) materials including 1,3,5 trinitro-s-triazine
(RDX) have characteristic spectral features in this range.5 Reflective
or transmissive THz spectra are claimed for several explosives, 5,6
bioagent simulants, and DNA. 7 The THz spectra of the explosives
appear to be distinct from the spectra of human skin and material such as
plastics and cloth. 5 It shows vibration features associated with
intermolecular interaction relative motions 8-11 from Terahertz time
domain spectroscopy (TDS), Fourier Transform Infrared (FTIR) experiments, and
computer simulation of the far-infrared spectra of organic molecules.
In measurement of optical material, the standard transmission spectroscopy method cannot independently determine optical constants of the material from the transmittance of such material. In real applications, fingerprint features are indistinguishable from the barrier’s material features without the detailed knowledge of the optical constants of such material. An application of ultrafast technique allows simultaneous measurements of the thickness and optical constants of the material. With this technique, it is possible to detect explosive material inside a common package of materials by employing a correlation detector with the available optical constants. The detector in the frequency range of far infrared can be an ideal sensor for identifying various terror attacks.
The generated and detected far infrared signal by the detector using the low temperature growth GaAs (LT-GaAs) can be expressed as:
![]() (1)
(1)
Optical Properties and Correlation Detection
For a lamina material with film thickness l on top of substrate 3, the transmitted THz field with multiple reflections is given by 12
![]() . (2)
. (2)
ψ=2pnl. (3)
![]() .
(4)
.
(4)
![]() , (5)
, (5)
where d<<c/w (for the micron film l<< 300 mm of 1 THz). Therefore, ψ <<1; n and k are refractive index and extinction coefficient, respectively, and e1 and e2 are real and imaginary parts of the dielectric constant. According to the Beer-Lambert law,
I=I0exp(-al), a=2wk/c. (6)
To disentangle the mixed responses of two materials, apply the differential time-domain spectroscopy through small signal simplification:
Ediff=Et -Eref. (7)
where the Eref refers to a reference electric field incident on the substrate only. Compared to the incident wave, Eref can be expressed as
Eref=t13E0(w)exp(iwd/c). (8)
This method works well for thin film material with very thin thickness, in the order of micrometers. The phase shift introduced by such film is assumed to be very small. For the material in the remote sensing and noninvasive detection, the condition usually is hard to meet and expect.
The following figures show the transmittance measurement using the THz-echo analysis study. As an example, consider the case of high resistive silicon, which has low absorption coefficient in the THz range, and then apply the method to other explosive materials. Consider the experimental geometry of Figure 1; the resulting THz waveform is shown to the right of Figure 1.
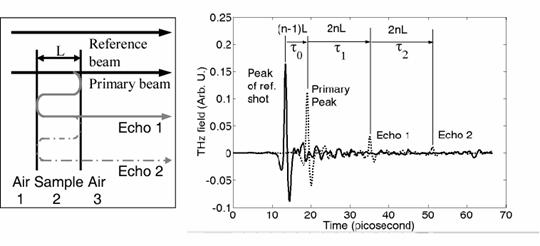
Figure 1: THz and pulse echo analysis method, where the THz echo analysis method uses a silicon wafer.
The reference signal is
![]() (9)
(9)
where ![]() (arrow implies that the value is a complex constant) the
complex index of refraction of air is nearly a constant number, except the
sharp features from water absorption. The primary THz pulse through the sample
can be expressed as
(arrow implies that the value is a complex constant) the
complex index of refraction of air is nearly a constant number, except the
sharp features from water absorption. The primary THz pulse through the sample
can be expressed as
![]() (10)
(10)
The echo (first multiple reflections) through the sample is
![]() (11)
(11)
where ![]() and
and ![]() are the reflection and
transmission coefficients on the interface, which are determined by the Fresnel
equations (normal incidence).
are the reflection and
transmission coefficients on the interface, which are determined by the Fresnel
equations (normal incidence).
Dividing (2) by (1) and dividing (3) by (2), one obtains
![]() (12)
(12)
![]() (13)
(13)
(12) and (13) are unusual approaches used for determining the system transfer function of a lamella. A usual transfer function of a material should take into account the multiple reflections at the same place. However, such transfer function is not advantageous in THz approach, where the various contributions may be separable in the time domain. Phase shift from sample interfaces can be accounted for as an almost constant value compared to the contributions from the thickness dependent term in T1 and T2.
In summary from the above equations, the phase of T1 (ÐT1) is determined by the optical path length difference: (nsample-nair)L; and the ÐT2, contrary to one’s intuition, has actually different information as 2nsampleL. When phase information from the primary pulse and echo are combined, the material thickness can be extracted directly. The sample thickness is
![]() (14)
(14)
After the thickness is measured directly with THz echo analysis method, the match filter can be constructed directly according to the noise n(t) and the measured T value,
![]() (15)
(15)
![]() (16)
(16)
If a filter transparency of amplitude transmittance T(n) multiplies the detected spectrum, the output is proportional to the amplitude transmittance of the filter.
The output can be represented as the convolution of the input with an impulse response h(t) of the match filter:
![]() (17)
(17)
![]() (18)
(18)
The above thickness estimation is useful for a
completely known response of the material. However, the multiple layers reflect
the signal multiple times, and a limited amount of signal precondition is
necessary. A problem might arise when applying this technique that the
limitation from the thickness of the material is unknown, and therefore the
matched filter is not complete without the thickness information. As a
result, the application of Neural
Network in pattern recognition is
investigated in the following section.
To estimate the
performance of THz imaging system, a related question is how complicated the
system under study can be. One can assume a spectrum of chemical mixture with
contributions from different types of materials, with concentration as a random
variable set to be determined. Without losing generality, we assume normal
distributions of various materials, with standard deviations from an estimated
concentration. In real situations, time and temperature variation of the
environment will result in a change of spectral distribution. The spectral
detection is therefore time and environment dependent; a fast timing gated is
generally required, and the following speckle analysis will yield the different
concentration information. The detected spectra depend on the distribution of
various materials. The resulting spectra are then weighted spectra of various
material; a linear relation is expected since THz-TDS probes linear response.
The detected response of the biological system is a linear relation:
![]() (19)
(19)
![]() (20)
(20)
where Xi(w, Z) is concentration for the ith material with standard concentration. The frequency dependence of concentration X (w, z) takes into account concentration dependent loss other than absorption; z is the depth inside the material and can be distinguished by the linear portion of time of flight information. In most cases, the frequency dependence of X can be approximated as constant value. Si is the characteristic spectrum of the ith material. Determined by the line shape used in the simulation or numerical curve fitting, Si usually included three parameters: the oscillation strength Dj, the decaying parameter sj and the center frequency wj. Three measured points are needed for uniquely determined three parameters of each oscillator. The concentration set {Xi} is the concentration solution for a particular mixture based on the known spectrum library, assuming a correlation detector is used:
![]() (21)
(21)
The information density is determined as:
![]() (22)
(22)
For the simplest case of determining whether a component appeared or not, the success of the hypothesis is determined by the distance between the spectra mixture:
![]() (23)
(23)
where the subscript 1 means the detection of this component, and 0 means the opposite case. Assuming that the spectrometer has a spectral range Dw with a spectral resolution dw, the largest signal resulted from absorption is M, and the least signal is m, the signal will be digitized as S(wj) upon detection, and then processed by pattern recognition program. The available information capacity of such signal is:
![]() (24)
(24)
where M/m
depends on the selection of Dw, the detection time for the
spectra will be less than 1/dw is. Dw/dw takes into account simultaneous detection of the
multiple channels signal at the same time. The system operation mode can be
either a pulse method or a CW method. The capacity C of such a noisy channel
should be larger than the maximum possibility of a mixture, determined by (16)
and (17). From the above equations, an increase in the spectral resolution will
greatly increase the channel capacity. That is a logical result when one faced
an information dense subject.
A special case of detection scheme is possible with the direct detection of a particular signal in the spectral domain using the heterodyne detection, where the signal was detected only at a particular wavelength with the same specified detection period. The same channel capacity is applied in this case, except without the multiplication factor Dw/dw.
Neural Network Analysis and Automatic Detection of
Hidden Explosive
Artificial Neural Network is a set processing element (neurons or perceptrons) with a specific topology of weighted interconnections between elements and a learning law for updating the weights of interconnection between two neurons. The complexity of ANN topology and the learning law depends on the complexity of the system. Some of the major factors that change the behavior of ANNs are number of neurons, number of interconnections and number of layers, weight schemes, threshold, and learning factors.
The roots of ANN can be traced to the work of
McCulloch. In an article in 1947, Pitts and McCulloch described networks of
artificial neurons capable of pattern classification. Although these networks
had some computational capabilities, it was not clear how such networks could
learn to perform specific tasks. The Hebbian learning rule, Delta rule and
generalized Delta rule were introduced as learning algorithms later. 13,14
In 1986, Rumelhart, Hinton, and William proposed an important learning
rule called the Back-Propagation Algorithm (BPA). 15 The BPA made
learning possible in ANNs with multiple layers and adjustable weights.
In this paper, a supervised Feedforward Multilayer
Perceptron (FMP) with BPA is used for pattern classification. In FMP, input patterns are fed into input of
multilayer and propagated forward to output layer. The output is compared with
a desired output, and the error signal will be propagated backward through the
network to adjust the weight of each layer using BPA. The FMP is static mapping
network and requires many presentations of input patterns (data) to be learned.
The BPA is a generalized least square algorithm that
minimizes the Mean Squared Error (MSE) between the desired and the actual
outputs of the network with respect to weights. The basic idea is to change the
weights in the direction of decreasing the total error of the ANN’s
outputs. The total error E of the
network over all of the training patterns is defined as:
![]() (25)
(25)
where T and NL
are the total number of pattern and neurons at output layer “L,” respectively,
and ek(p) is the error associated with the pth pattern at the output layer. The MSE used to
minimize the error is expressed as:
![]() (26)
(26)
where the dk(p) and YLk (p) are the desired and measurement outputs of the network at the kth neuron. The network weights connections Wl i,j between neurons i and j in layer l (l=1,…,L) are updated iteratively by the Generalized Delta Rule:
![]() (27)
(27)
where μ is the learning rate. Furthermore, using the “chain rule,” the above equation can be summarized for an output layer and hidden layer as follows:
Output Layer L:
![]() (28)
(28)
where k is the neuron in the output layer and j is the
neuron in the hidden layer “L-1” and
![]() (29)
(29)
Hidden layer L-1:
![]() (30)
(30)
The nonlinear transfer function F(Z) is sigmoid function which is differentiable and invertible.
In simulation of learning process of BPA, if the learning rate μ is small, the algorithm will approximate true parameters iteratively which converge to a global or local mini. However, if μ is too large, oscillation will result from speeding the learning process. But this can be minimal by adding a momentum term 13 to weight equation
![]() + βΔWli,j(t-1)
(31)
+ βΔWli,j(t-1)
(31)
where β is a constant controlling the amount of momentum in the weight space.
In
simulations, the data of experimental resonance frequencies for RDX given in
Table 1 11 were used as input
patterns.
Table 1. Experimental resonance frequencies for RDX 11
|
Experimental |
|||
|
Peak |
wj (THz) |
aj (arb. U.) |
sj (THz) |
|
1 |
0.79 |
1.21 |
0.11 |
|
2 |
1.05 |
0.16 |
0.06 |
|
3 |
1.34 |
023 |
0.09 |
|
4 |
1.44 |
0.11 |
0.11 |
|
5 |
1.56 |
0.13 |
0.11 |
|
6 |
1.77 |
0.06 |
0.12 |
|
7 |
1.92 |
0.20 |
0.11 |
where aj, wj, and sj are the oscillator strength, the frequency, and linewidth of the jth .
With designed architecture, the Neural Network
is trained with 2000 randomly generated patterns so that it identifies the
patterns that closely resemble the RDX features. For this purpose, the Neural
Network was trained and tested in two cases: one is without tolerance for any
wandering away from the main features, and the other assumes a certain region
is a more realistic testing assumption, as long as the features falling within
the spherical region are defined by a 21 dimensions vector.
Experimental data have shown RDX as a material with bountiful features; it should be suitable for neural network analysis. To detect such features, one can use the mature digital identification methods. The neural network was trained to minimize the MSE to be less than 0.01. Approximately, after 200,000 or more iterations, ANN using FMP with BPA learning method was able to identify the correct patterns for both cases. The desired outputs for accepted or rejected patterns were “1” or “0,” respectively. Figures 2A and 2B show the results of measurement outputs and the desired output for the spherical region.
Figures 2A, 2B shows the NN simulation results for 80 and 2000 patterns respectively.
Conclusion
In this research, a THz echo analysis is used as an effective way of determining the optical constants and material thickness independently. The time domain recording of THz waveform has rich spectral information that can be used to reveal depth information of an agent. A spectral domain estimation of the absorption coefficient is used in estimating the particular peak for identifying particular material. Neural Network has been analyzed as an effective way of identifying RDX through a 21 dimension fingerprint spectral features matching. A Neural Network was designed and implemented to reduce false alarms of the detection system.
References
[1] D. H. Auston, K.P. Cheung, P. R. Smith, “Picosecond photoconducting Hertzian dipoles,” Appl. Phys. Lett. 45, 284 (1984)
[2] M. v. Exter, C. Fattinger, D. Grischkowsky, “High-brightness terahertz beams characterized with an ultrafast detector,” Appl. Phys. Lett. 55, 337 (1989)
[3] J. Orenstein, A. J. Millis, “Advances in the Physics of High-Temperature Superconductivity,” Science 288, 468 (2000).
[4]
Taday, P.
F., Bradley, I. V., Arnone, D. D., and
Pepper, M., “Using Terahertz pulse spectroscopy to study the crystalline
structure of a drug: A case study of the polymorphs of ranitidine
hydrochloride,” Journal of Pharmaceutical Sciences, vol. 92, no. 4, pp. 831- 838 (2003).
[5] Kemp, M. C., P. F. Taday, B. E. Cole, J. A. Cluff, A. J. Fitzgerald, and W. R. Tribe, “Security applications of terahertz technology,” SPIE 5070 (2003).
[6]
D. W. van derWeide (2001). “Wideband Terahertz Sensing
and Spectroscopy with Electronic Sources and Detectors,” In R. E. Miles et al.
(eds.), Terahertz Sources and Systems.
[7]
D. Woolard, T. Globus, E. Brown, L. Werbos, B. Gelmont,
and A. Samuels, “Sensitivity Limits & Discrimination Capability of THz
Transmission Spectroscopy as a Technique for Biological Agent Detection ” Proc.
5th Joint Conf. On Standoff Detection for Chemical and Biological Defense,
[8] J. Xu, H. Liu, R. Kersting, X. Zhang, “Advancing terahertz time-domain spectroscopy for remote detection and tracing, ” Terahertz for Military and Security Applications, Proceedings of SPIE, PDS, 5070-03, Orlando, FL April 21-25 (2003).
[9]
Heimer, T. A. and Heilweil, E. J., “Applications of
Ultrafast Transient Infrared Spectroscopies,” Bulletin of the Chemical Society
of
[10] F. Huang, J. Federici, D.
[11] F. Huang, B. Schulkin, H. Altan, J. Federici, D. Gary,
R. Barat, D. Zimdars, M. Chen and D. Tanner, 'Terahertz Study of 1,3,5-Trinitro-s-triazine
(RDX) by Time Domain Spectroscopy and FTIR', Appl. Phys. Lett. 85, 5535, (2004).
[12] F. Huang, J. Federici, and D.
[13] L.
Kellner, Z. phys. 56, 212 (1929); M. Born and E. Wolf, Principles of
Optics, 6th Edition, Chapter 7.6
[14] Hecht-Nielson R., Neurocomputing, Addison-Wesley, 1990.
[15] Khanna T., Fundation of Neural Networks, Addison Wesley 1990.
[16] Rumelhart D., Hinton G.E., and William R.J., “Learning representation by error propagation”, In Rumelhart and McClelland, Parallel Distribution, V1 MIT, 1986.