
Volume 3, Number 2, Spring 2003
A New Mobility Model and Its Effects on a Mobility-Sensitive CAC Scheme [1]
Tuna Tugcu
Georgia Tech Regional Engineering Program
College of Engineering
Georgia Institute of Technology
Cem Ersoy
Computer Networks Research Lab
Department of Computer Engineering
Bogazici University
Bebek, Istanbul 30318
Abstract
The validity of the mobility model used to evaluate a cellular network determines the validity of the evaluation. In the literature, unrealistic assumptions on mobility are exercised for the sake of simplicity. In this paper, we present a novel mobility model which is realistic in the sense that it captures the moving-in-groups, conscious traveling, and inertial behaviors of the subscribers while respecting the non-pass-through feature of structures like households, and preserving the autonomy of the subscribers. The mobility and call patterns of the subscribers are determined according to the locus of the subscriber over a real map. Thus, our model allows the subscribers to leave home or arrive home, walk or drive in the streets, get on the highways at specific entry points together with numerous hot and blind spots in the terrain, like city centers and lakes. The call pattern of a subscriber is affected by the type of structure he is in. The model can work on real maps to simulate the mobility patterns in real life. We have evaluated the proposed model against the well-known way point mobility model. We also analyzed the effect of the mobility model on systems with and without guard channels.
Evaluating a scheme proposed for cellular mobile networks is a cumbersome process. The effect of thousands of autonomous mobile subscribers on the system performance can be examined by either analytical methods or simulations. The analytical methods are favorable since they provide fast and theoretical results. However, such methods consider the society as a whole, disregarding the individual behavior of the subscribers. Furthermore, many unrealistic assumptions must be made in order to simplify the underlying mathematics. On the other hand, simulators can implement the individual subscribers at the cost of long run times. Thus, in simulations, instead of approaching the problem as a bulk of subscribers, the society is constructed from the individuals.
Implementation of the autonomy of the subscribers is the crucial point of a mobility model. Each subscriber chooses his direction individually, as in real life. However, in real life, one can also observe that the direction of a subscriber is also dictated by the terrain. Although each subscriber makes his decisions independent of the other subscribers, he cannot decide to drive over a house. If the street has a turn to the left, everyone on the street is supposed to turn to the left as long as they stay on the street. Thus, although the subscribers are autonomous, they drive or walk together on the streets and highways. This is called the moving-in-groups behavior of the society.
An autonomous subscriber updates his direction randomly so that the subscribers exhibit stochastic mobility patterns. However, determining the new direction independent of the old one will result in a simulator where subscribers make unconscious moves, back and forth. A realistic mobility model should capture the conscious traveling feature of the subscribers where the subscribers tend to keep their directions towards a destination. However, this tendency is still subject to the non-pass-through feature of some structures in the terrain, as explained in the previous paragraph. The model should also force the subscribers to enter and leave the highways only at specific entrance and exit points. Furthermore, each subscriber exhibits an inertial behavior to preserve the type of structure he is on. A subscriber driving on a street is more likely to keep driving on the street than entering a household. However, the tendencies to switch from one type of structure to another should also be defined so that subscribers may prefer getting from the street to the avenue and vice versa. In addition to the mobility pattern, the call pattern of a subscriber is also affected by the structure on which the subscriber resides. Thus, the call pattern of the subscriber is altered when the mobile leaves home and starts driving.
The distribution of the subscribers over the service area is one of the crucial points in cellular systems. Unrealistic assumptions, like uniform distribution of the subscribers over the service area, results in even sharing of the load among the base stations. However, this contradicts with the real life case. The population density must be different throughout the service area denoting hot and blind spots like city centers and lakes.
Finally, the underlying air interface should also be considered since the
signal propagation is determined by the coordinates of the mobile. The mobility
and call patterns, together with the population density effect the signal
propagation, which becomes more crucial if Code Division Multiple Access
(CDMA) technology is to be considered for the air interface, as in the ![]() generation systems.
The approximation for interference propagation in CDMA systems, given in [1],
is commonly adopted in the literature. However, this approximation is based on
the assumption that the mobiles are distributed evenly over the service area.
If such an unrealistic assumption is to be ed, one must also devise a
method for interference propagation.
generation systems.
The approximation for interference propagation in CDMA systems, given in [1],
is commonly adopted in the literature. However, this approximation is based on
the assumption that the mobiles are distributed evenly over the service area.
If such an unrealistic assumption is to be ed, one must also devise a
method for interference propagation.
In this paper, we propose a novel mobility model that captures the moving-in-groups, conscious traveling and inertial behaviors of the subscribers while respecting the non-pass-through features of the structures in the terrain. The mobility and call patterns of the subscribers are determined according to the locus of the subscriber in the terrain where the terrain is defined by real maps including hot and blind spots. The real life mobility patterns like walking, driving on the roads, entering and exiting highways, arriving and leaving home, even rowing across the Bosphorus can be implemented. We have evaluated the proposed model against the well-known way point mobility model, and obtained promising results. Since we defer the assumption that the mobiles are evenly distributed over the service area, we have also devised a method to calculate the actual interferences. The rest of the paper is organized as follows. In the next section, we discuss the previous work in the literature. The proposed model is presented in Section III, followed by simulation results in Section IV. We give the conclusions and future work in Section V.
Most of the work in the literature on mobile networks assumes random walk [2]-[6], Brownian motion [7], [8], or cell change probability based on the side of the hexagon through which the subscriber leaves the cell [9], [10]. Although these models simplify analysis, they rely on unrealistic assumptions, and the mobility patterns produced do not resemble the human behavior in the real life. In [11], Chiang et al. propose a simple random walk model that simplifies the two-dimensional Markov chain by benefiting from symmetry and lumped processes. In [12], Zonoozi et al. develop a mathematical formulation for systematic tracking of the random movement of the subscriber. The authors show that the cell residence time can be described by the gamma distribution, and the channel holding time by the negative exponential distribution. In [13], Tonguz et al. use a straight-line motion, a two-dimensional random walk model, and a biased Markovian motion. In the activity-based model proposed in [14], the mobility patterns of the subscribers are based on an activity transition matrix. The authors use the matrix created by the Regional Municipality of Waterloo, Ottawa. However, it is very difficult to obtain such a matrix for other cities. In [15], Bettstetter smoothes the sudden changes at the turning points during a subscriber's movement by introducing acceleration. However, group movement and change in mobility patterns due to physical obstacles is disregarded. In [16]-[18], way point mobility model is used for ad hoc networks. In [19], Yang et al. propose a model based on the mobility patterns of traveling salesmen. It is basically a stop-or-move method between cells, and it remembers the roaming direction. However, their scheme relies on a regular hexagonal cellular layout, and does not model hot and dead spots. In [20], Markoulidakis et al. have proposed a model with three levels: city area model, area zone model and street unit model, therefore the geographic area needs to be molded into these three levels. In [21], Leung has modeled a highway with multiple entrances and exits as a deterministic fluid model. Different kinds of mobility models have been proposed in publications on ad hoc networks [22], [23]. However, since such networks are designed for disaster areas and military applications without any fixed cellular network their mobility patterns differ from those in a cellular system. In [24], Kim et al. consider three-dimensional mobility for indoor environments.
ETSI has defined test scenarios for the indoor office, outdoor pedestrian,
and vehicular environments [25]. A Manhattan-style
street structure is defined for the outdoor
pedestrian environment, and a random mobility model without any street
structure for the vehicular environment. Furthermore, the speed of the cars is
assumed to be fixed at ![]() .
.
In addition to the theoretic work, simulators like Opnet, NS-2 and GloMoSim also implement mobility models. However, Opnet and NS-2 have a very simple mobility models. GloMoSim has been developed for ad hoc systems and it is not suitable for cellular networks.
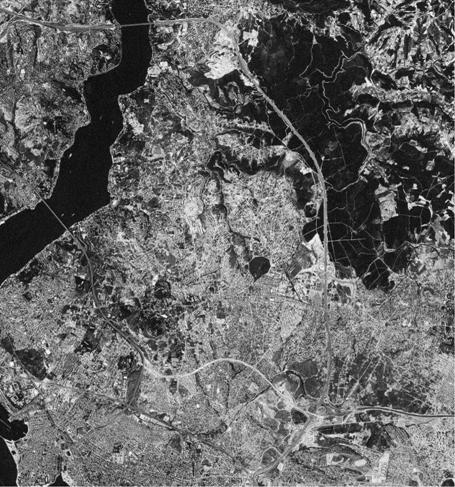
The proposed model generates stochastic mobility and call patterns according to a given real map (e.g., Figure 1). The model is independent of the map, therefore mobility and call patterns for different scenarios can be generated easily. The map is composed of different structures like houses, streets, highways, lakes, etc., and there is no limit on the number of these structures. Mobility pattern parameters (e.g., speed distribution), call pattern parameters (e.g., idle duration), probability of switching to other structure types, and probability of a mobile device being turned on in that type of structure are specified as parameters to the model. Each block (pixel) in the map has a different color, where the color represents the type of structure. The users are initially distributed over the service area according to the type of blocks. The mobility and call patterns of the users are also determined according to the block type parameters. Thus, the proposed model is able to distribute autonomous subscribers over the service area, and generate stochastic mobility and call patterns for these subscribers. The discriminating feature of the model is that mobility and call pattern generations, together with the initial subscriber distribution, are based on real maps. In this manner, initial subscriber distribution is realistic, and subscribers in the same region of the terrain exhibit similar mobility and call patterns. For example, although the subscribers are autonomous, all subscribers on a road have to turn to the right if the road has a curve to the right. Furthermore, some structures in the terrain, like households, may be set to be more likely places for the subscribers to turn their handsets on.
|
|
|
Figure 1: Map of Asian side of Istanbul |
Once a mobile terminal has been turned on, its direction is determined by the surrounding structures. This does not violate the fact that subscribers make autonomous decisions, since in the real life the movements of a human are also restricted by the environment. A subscriber decides whether he will switch to a different type of structure based on a matrix of structure switching probabilities. The change in the type of structure the subscriber is residing on implies a change in the mobility and call patterns of the subscriber.
It is possible that the subscriber reaches the boundary of the terrain while moving in a definite direction. Allowing the mobile to move out of the terrain will result in fewer subscribers in the service area, which may lead the simulation to end before the lifetime of all of the subscribers have expired. In the literature, reflecting boundaries are introduced to prevent such cases. In the reflecting boundaries approach, a subscriber who is about to leave the service area is reflected back to the service area at the same point. Since this sudden turn of the subscriber is not very realistic, we introduce the symmetric insert approach. In the symmetric insert approach, a subscriber who is about to leave the service area will be re-inserted from the other boundary of the service area. Thus, we add a new subscriber to the system while another one leaves the system so that the total number of subscribers does not change.
Signal propagation in wireless systems requires special attention. Since the details of signal propagation is beyond the scope of this work, we simply employ free space signal propagation [26] in our research. However, we still calculate the actual outer cell interference instead of employing the approximation introduced in [1] which is based on assumptions we defer (see the following subsection for details).
In a stochastic system design, the implementation of the distributions determines the validity of the system. We have used the CNCL package for our distributions since it is a widely used and proved-to-be-correct library.
Features Implemented by the Proposed Model
The proposed mobility model distributes the subscribers unevenly over the service area, and determines the mobility and call patterns of each mobile according to the structure the mobile is residing on. A real map with different types of structures (houses, streets, avenues, highways, sea, etc.) defines the service area. For each type of structure, the following parameters are defined:
- Mobility pattern parameters: Speed distribution, life time distribution.
- Call pattern parameters: Idle duration distribution, call duration distribution.
- Rate at which a subscriber may turn on his mobile terminal on such a structure.
- Probabilities of switching from this type of structure to all other types.
By the help of the mobile turn on rate, the unrealistic assumption of uniform distribution of the subscribers over the service area is ed. Some structures may be set to be favored more than others for the initial distribution. The life time of the mobile, the duration for which the mobile station remains turned on, is determined when the mobile is turned on.
Subject to the structure switching probabilities matrix, the subscribers move over the map. The trajectory followed by a subscriber is the concatenation of multiple line segments. In other words, once a subscriber has chosen a direction, he will move in that direction for a definite duration, called the step size, until he chooses a new direction. As the step size gets smaller, the trajectory of the subscriber approaches a curve, at the expense of longer simulations. The step size can be drawn from a distribution so that the time between two direction updates varies. The speed of the subscriber is also updated every time the subscriber updates its direction. If the type of structure the subscriber is on has changed, the speed, idle duration and call duration distributions of that subscriber also change. Thus, the subscriber will change his speed and call pattern when he switches from one structure to another. For example, when the subscriber leaves home and starts driving on the streets, both his speed and call pattern will change.
The structure switching probabilities are also used in determining the direction of the subscriber. When it is time to update the direction, the subscriber will look at his surrounding at a distance he can cover in one step, dictated by the step size, and choose his new direction. The probability of moving in any direction is determined according to the structure switching probabilities. For example, a subscriber moving on a street may rather go to an avenue than his home. Thus, most of the subscribers on the streets will get on the avenues whereas fewer subscribers go home. The simulation time is limited to several hours (enough to simulate rush hours traffic) to accumulation of subscribers on the highways. By utilizing the structure switching probabilities, it is also possible to implement the non-pass-through feature of some structures and the special entry and exit points to the highways. By setting the switching probability to a structure to zero, the structure will gain the non-pass-through feature. Similarly, by setting the switching probabilities to/from the highway structure, except the connection roads, the special entry and exit points to the highways through the connection roads are implemented.
The inertia behavior of the subscribers is implemented by setting the switching probability from a type of structure to the same type to a value higher than other probabilities. Thus, a subscriber will prefer keeping the type of structure he is on. The inertia behavior helps ing subscribers who change their minds very frequently. Without the inertia behavior, subscribers will visit every house on a street, like a postman.
If the new direction of the subscriber is determined by just considering the
structure change probabilities, a subscriber going on a street may suddenly
turn ![]() backwards, go in that
direction for one step, and turn back again. Since humans will not make such
unconscious moves, a subscriber in our model favors directions close to his
current direction. After the probabilities of moving in all directions have
been calculated from the structure switching probabilities matrix, these
probabilities are updated to favor directions closer to the current direction
of the subscriber. Thus, although it is possible that the mobile may turn
backwards, go in that
direction for one step, and turn back again. Since humans will not make such
unconscious moves, a subscriber in our model favors directions close to his
current direction. After the probabilities of moving in all directions have
been calculated from the structure switching probabilities matrix, these
probabilities are updated to favor directions closer to the current direction
of the subscriber. Thus, although it is possible that the mobile may turn ![]() , it is less likely. We call this kind of behavior as
conscious traveling.
, it is less likely. We call this kind of behavior as
conscious traveling.
Although subscribers are autonomous entities, each subscriber is subject to the mobility pattern determined by the terrain. Therefore, most of the subscribers on the same structure will tend to exhibit, not the same but similar mobility and call patterns. Thus, the moving-in-groups behavior of the society is implemented. For example, not only will most of the subscribers on a street prefer staying on the street, they will also have close speeds and call patterns.
The implementation of all these features in a mobility model is a novel approach. Furthermore, the ability to support a stochastic mobility model with a real map adds power to the proposed model. The integration of the real map enables examining subscriber mobility on different service areas, like suburbs and rural areas.
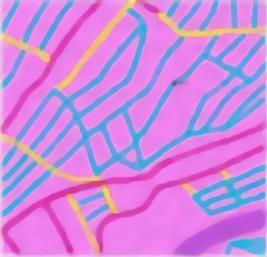
The validation of the proposed model is a difficult task since it employs features based on subjective measures. Although it cannot substitute a formal proof, the best validation for such a model is visualization. We have implemented a graphical interface (Figure 2) for the validation by using the EZD tool developed by DEC. By the help of the graphical interface, we have validated that the proposed model provides the features claimed. The reason for choosing EZD is the support for EZD by the CNCL library. However, EZD is not powerful enough to handle thousands of mobiles. Since the implementation of such a powerful graphical interface is beyond the scope of this research, the authors have been contended with EZD.
Algorithm of the Proposed Scheme
The proposed mobility scheme is implemented with an event-driven algorithm.
There are ![]() events: StartSimulation,
WarmupFinished, StopSimulation, MobileTurnOn, MobileActivate,
DirectionUpdate, CallStart, CallTermination, and Handoff.
The first three events are global to the system whereas the rest of the events
are scheduled per mobile. Since an event-driven approach is used, the algorithm
is demonstrated by explaining the actions to be taken on the reception of each
event. The algorithm is as given in Figure 3 and 4.
events: StartSimulation,
WarmupFinished, StopSimulation, MobileTurnOn, MobileActivate,
DirectionUpdate, CallStart, CallTermination, and Handoff.
The first three events are global to the system whereas the rest of the events
are scheduled per mobile. Since an event-driven approach is used, the algorithm
is demonstrated by explaining the actions to be taken on the reception of each
event. The algorithm is as given in Figure 3 and 4.
|
v case StartSimulation: Ø For all base stations § assign the frequency bands, § initialize all resources in the cell as free. Ø Create all mobiles (MSs). Ø Create the random variables for: § physical block in which MS will reside, § distribution of MSs to the blocks according to map, § displacement of MSs inside the blocks, § MS turn on rate. Ø Schedule the MobileTurnOn event for each MS. Ø Schedule the WarmupFinished event. v case WarmupFinished: Ø Verify all MSs are turned on before warmup period is finished. Ø Instruct all MSs and BSs to start gathering statistics. v case StopSimulation: Ø All gathered statistics are evaluated. v case MobileTurnOn: Ø Assure MS is not in a partially covered cell at service area boundary. Ø Initialize MS attributes and statistics. Ø Find MS class according to the physical block. Ø Set random variables for idle and call durations, and speed distribution. Ø Find speed and direction according to MS class and map. Ø Find the controlling BS for MS. Ø Schedule MobileActivate event for MS. v case MobileActivate: Ø Schedule DirectionUpdate event for MS. Ø Schedule CallStart event for MS. v case DirectionUpdate: Ø Move MS to new position according to speed, direction, and step size. Ø If MS has moved out of service area: § Terminate any ongoing call prematurely, but do not consider it as a call drop since the reason for termination is not lack of resources. § Release the resources allocated for the call. § Schedule new CallStart event. § Re-locate MS in a new block according to the map. § Find the controlling BS. Ø Find MS class according to the physical block. Ø If MS class has changed, set the random variables for idle duration, call duration, and speed distribution. Ø Find speed and direction according to MS class and map. Ø If MS has moved into a new cell, find controlling BS. Ø If there is an ongoing connection: § Find handoffs points till the next DirectionUpdate event. § Schedule a Handoff event for each handoff point. § Propagate interference to other MSs in neighbor cells. Ø Schedule DirectionUpdate event for MS. |
|
Figure 3: Algorithm of the proposed scheme |
|
v case CallStart: Ø Check the resources in the current BS to find if the call request can be accommodated. Ø If the call is accepted: § Update "successful call start" statistics. § Schedule CallTermination event. § Find handoff points till the next DirectionUpdate event. § Schedule Handoff event for each handoff point. § Propagate interference to other MSs in neighbor cells. Ø If the call is rejected: § Update "blocked calls" statistics. § Schedule a new CallStart event. v case CallTermination: Ø Update "successful call termination" statistics. Ø Release the resources allocated for the call. Ø Schedule CallStart event for MS. v case Handoff: Ø Move MS to the handoff point. Ø Check the resources in the new BS to find if the handoff request can be accommodated. Ø If the handoff request is accepted: § Update "successful soft handoff" or "successful hard handoff". § Propagate interference to other MSs in neighbor cells. Ø If the handoff request is rejected: § Update "dropped calls" statistics. § Schedule a new CallStart event. |
|
Figure 4: Algorithm of the proposed scheme (continued) |
The choice of the mobility model used in the evaluation has a significant role in the performance of mobile systems. Features such as initial distribution of the subscribers over the service area, effect of physical terrain on the subscribers' mobility patterns and similarity in the behaviors of subscribers on the same physical structure is difficult to capture with stochastic methods. We set up the experiments so that the effects of the mobility model and the map of the terrain are highlighted.
We compared the proposed realistic mobility model against the way point model. The speed of each subscriber in the realistic mobility model is drawn from a distribution, which is determined according to the structure he is on. However, the speeds of all of the subscribers in the way point model are drawn from the same distribution. We have set the mean speed used in the way point model to be the mean of the observed average speeds of all subscribers in the proposed mobility model.
We used two different kinds of maps for the underlying topology of the
realistic model in order to study the effect of the map on the performance of
the model. One of these maps is a ![]() portion of the real
map in Figure 1) with
portion of the real
map in Figure 1) with ![]() resolution. The other
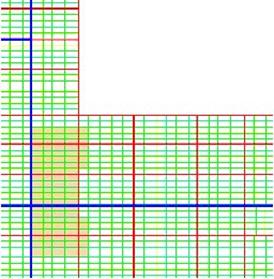
map is a handmade, grid-structured Manhattan-style network (Figure 5). We
also introduced some irregularity and a hot spot in the Manhattan-style
network.
resolution. The other
map is a handmade, grid-structured Manhattan-style network (Figure 5). We
also introduced some irregularity and a hot spot in the Manhattan-style
network.
We also analyzed the effect of the mobility model on different call admission schemes. We considered three different call admission schemes:
- Plain scheme: All channels in the cell are assigned in first-come-first-served manner, without giving any priority to handoff calls.
- Classical scheme: In each cell, a fixed number of guard channels are set aside to handle possible handoff calls. Handoff calls are prioritized over new calls in this manner as long as such a channel is available. These channels cannot be utilized if there are not enough calls. We have set the number of guard channels to three, since this is the value frequently used in the literature.
- Reservation-based scheme: Channels are reserved dynamically for handoff calls. The performance of this scheme is sensitive on mobility since the cells in which reservations will be made are determined according to the mobility of the subscriber in the near past. This scheme is described in more detail in [27].
We used two scenarios with different system loads in the experiments. Thus, we analyzed the effect of different mobility models on these schemes under both heavy and light load cases. For each experiment, the call dropping probability (CDP) and the call blocking probability (CBP) values are sketched.
The block type change probabilities are given in Table I. The simulation parameters for the heavy load and the light load scenarios are given in Tables II-III and Tables IV-V, respectively.
|
Parameter |
Value |
|
Service area |
6.4km x 6km (real map and pure Manhattan style) |
|
Cell radius |
0.6 km |
|
Number of cells in interference range |
18 |
|
Data rate |
9600 bps |
|
Chip rate |
1228800 chips/sec |
|
Eb/No |
5 |
|
Nt |
|
|
a |
0.375 |
|
g |
4.0 |
|
Map granularity |
4 m/step |
|
Step duration |
5 sec/step |
|
Number of directions |
17 |
|
Number of block types |
7 |
|
Subscriber call and mobility patterns |
See Table III |
|
Block type change probabilities |
See Table I |
|
Parameter |
Value |
|
Service area
|
6.4 km x 6 km (real map and pure Manhattan-style network) 3.28 km x 3.36 km (Manhattan-style network with hot spot) |
|
Cell radius
|
1 km (real map and pure Manhattan-style network) 0.2 km (Manhattan-style network with hot spot) |
|
Number of cells in interference range |
18 |
|
Data rate |
9600 bps (real map and pure Manhattan-style network) 19200 bps (Manhattan-style network with hot spot) |
|
Chip rate |
1228800 chips/sec |
|
Eb/No |
5 |
|
Nt |
|
|
a |
0.375 |
|
g |
4.0 |
|
Simulation duration |
30 min |
|
Warmup period |
5 min |
|
Map granularity |
4 m/step |
|
Step duration |
5 sec/step |
|
Number of directions |
17 |
|
Number of block types |
7 |
|
Subscriber call and mobility patterns |
See Table V |
|
Block type change probabilities |
See Table I |
|
Table V: Subscriber call and mobility patterns with respect to block type for the light load scenario |
|||
|
Block type |
Pattern |
Type of distribution |
Parameter(s) of distribution |
|
0 Empty region |
-
|
-
|
-
|
|
1 Households |
Idle duration |
Normal |
(1 min, 1 min) |
|
Call duration |
Exponential |
600 sec |
|
|
Speed |
Normal |
(5 km/h, 5 km/h) |
|
|
Life time |
Normal |
(300 min, 300 min) |
|
|
Effective weight |
- |
5 |
|
|
2 Streets |
Idle duration |
Normal |
(2 min, 2 min) |
|
Call duration |
Exponential |
300 sec |
|
|
Speed |
Normal |
(30 km/h, 30 km/h) |
|
|
Life time |
Normal |
(300 min, 300min) |
|
|
Effective weight |
- |
5 |
|
|
3 Avenues |
Idle duration |
Normal |
(3 min, 3 min) |
|
Call duration |
Exponential |
300 sec |
|
|
Speed |
Normal |
(60 km/h, 60 km/h) |
|
|
Life time |
Normal |
(300 min, 300 min) |
|
|
Effective weight |
- |
15 |
|
|
4 Boulevards |
Idle duration |
Normal |
(5 min, 5 min) |
|
Call duration |
Exponential |
360 sec |
|
|
Speed |
Normal |
(80 km/h, 80 km/h) |
|
|
Life time |
Normal |
(300 min, 300 min) |
|
|
Effective weight |
- |
40 |
|
|
5 Connection roads |
Idle duration |
Normal |
(5 min, 5 min) |
|
Call duration |
Exponential |
480 sec |
|
|
Speed |
Normal |
(110 km/h, 110 km/h) |
|
|
Life time |
Normal |
(300 min, 300 min) |
|
|
Effective weight |
- |
80 |
|
|
6 Highways |
Idle duration |
Normal |
(5 min, 5 min) |
|
Call duration |
Exponential |
480 sec |
|
|
Speed |
Normal |
(140 km/h, 140 km/h) |
|
|
Life time |
Normal |
(300 min, 300 min) |
|
|
Effective weight |
- |
150 |
|
Effect of the Mobility Model on Different Call Admission Schemes
|
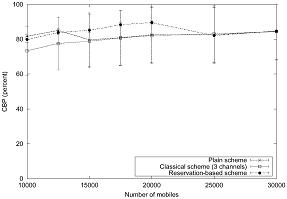
Figure 7: Effect of mobility pattern on the reservation-based scheme |
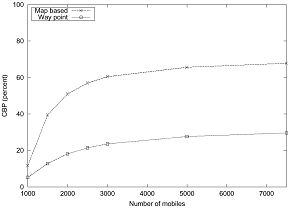
The effect of the mobility pattern under heavy load is analyzed on both the plain scheme (Figure 6) and the proposed scheme (Figure 7). Since the subscribers are accumulated at specific parts of the terrain with the realistic mobility model, its CBP is well above that for the way point model. The reason for higher CDP in the way point case can be explained by considering the mobility patterns of the subscribers as follows. In the way point model, all subscribers exhibit similar mobility patterns. However, in the realistic model, subscribers at home almost never encounter handoffs. In other words, the number of subscribers subject to handoffs is higher in the way point model, although the average speeds for both models is the same. Therefore, since fewer subscribers may be moving at higher speeds in the realistic model, the number of handoff attempts is less than the number of handoffs created by all subscribers in the way point model.
|
|
|
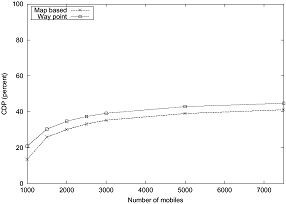
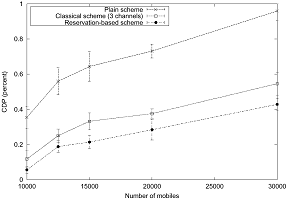
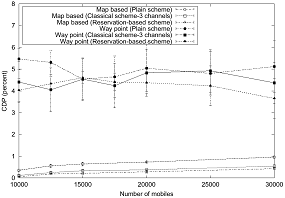
Figure 9: Different call admission schemes with the way point model |
The effect of mobility model on the plain, classical and reservation-based
schemes is studied also under light load (Figures 8 and 9). One can
observe that with the way point model, the plain scheme cannot be distinguished
from the classical guard channel scheme. The reservation-based scheme performs
slightly better than both of the other schemes, but the difference is not
significant. However, we should note that the reservation-based scheme is more
stable than the other two schemes in terms of load, i.e., the number of
subscribers. The number of seeds used for the experiments in Figures 8 and
9 are the same. The high variation in Figure 9 represents the unstable
nature of the way point model. The reason for the low dropping probabilities,
with respect to the high blocking rates is that the mean speed of the mobiles
in the way point model is only ![]() .
.
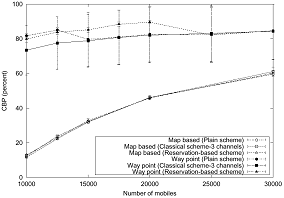
The results obtained in Figures 8 and 9 are plotted together in Figure 10 to emphasize the difference. It is apparent that the way point model drastically overestimates CDP and CBP. The more important point to be noted in the graphs is that with the way point model, for all of the three schemes, it is difficult to follow the trend in the system performance as the number of mobile stations increase. Furthermore, the variation in the way point model is very large whereas it is almost negligible in the realistic model although the number of seeds is the same for both cases. Our realistic mobility model, in addition to giving lower CDP and CBP values, gives steadily increasing CDP and CBP values, for all three schemes, as the load increases.
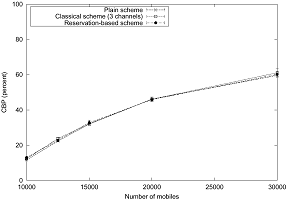
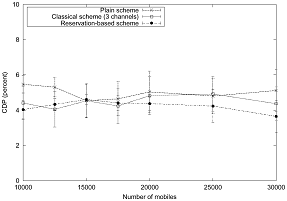
Effect of Map Type on the Performance of the Realistic Mobility Model
|
|
|
Figure 12: Effect of map type under light load |
The effect of the map type on system performance is analyzed in
Figures 11 and 12 under heavy and light loads. It is visible from the
graphs that the change in the type of map does not cause a significant change
in the trend of the behavior of the system, but there is a considerable difference
in the values of both CDP and CBP with respect to the real map. The main reason
for this difference is that the corners in the Manhattan-style network are very
sharp, and a subscriber who re-evaluates his direction just before the corner
will not choose to turn at the corner. Even subscribers who re-evaluate their
direction just at the corner will choose turning at the corner with a very low
probability since turning implies a major change (![]() ) in direction. Therefore, it is very likely that a
subscriber tends to keep his direction and stay on the same street for a long
time. Thus, the reservation area becomes very narrow. The results obtained
using the Manhattan-style network heavily depend on the step duration (time
period during which the subscriber does not change his direction and speed),
since with smaller steps it will be more likely that the subscriber
re-evaluates his direction at the corner. On the other hand, when a real map is
used, most of the corners are smoother, allowing smaller changes in direction.
Furthermore, in the Manhattan-style network, the subscribers also make very
sharp turns at the corners, suddenly moving out of the narrow reservation area.
The reason for the increase in blocking can be explained by the distance
between the avenues, which seems to be closer than the real map. The reader
should note that, the Manhattan-style network has been created simply by the
repetition of a small segment. The service area in the Manhattan-style network
is equal to the available service area in the real map, i.e., what remains
after unused regions (like the sea) are extracted.
) in direction. Therefore, it is very likely that a
subscriber tends to keep his direction and stay on the same street for a long
time. Thus, the reservation area becomes very narrow. The results obtained
using the Manhattan-style network heavily depend on the step duration (time
period during which the subscriber does not change his direction and speed),
since with smaller steps it will be more likely that the subscriber
re-evaluates his direction at the corner. On the other hand, when a real map is
used, most of the corners are smoother, allowing smaller changes in direction.
Furthermore, in the Manhattan-style network, the subscribers also make very
sharp turns at the corners, suddenly moving out of the narrow reservation area.
The reason for the increase in blocking can be explained by the distance
between the avenues, which seems to be closer than the real map. The reader
should note that, the Manhattan-style network has been created simply by the
repetition of a small segment. The service area in the Manhattan-style network
is equal to the available service area in the real map, i.e., what remains
after unused regions (like the sea) are extracted.
We studied the effect of the type of map under light load (Figure 12). As in the heavy load scenario, the change in the type of map does not cause a significant change in the trend of the behavior of the system, but both CDP and CBP values differ vastly. The same reasons, i.e., the effects of the sharp corners in the Manhattan-style network, explain the similar but shifted curves obtained from two different maps.
|
|
|
Figure 13: Effect of reservations under very light load |
|
|
|
Figure 14: Effect of reservation duration under very light load |
 <
<


We
also analyzed the effect of reservations when call blocking probability is
below ![]() , a slight variation of the light load scenario. It is
apparent from Figure 13 that call dropping probability is significantly
reduced also in the case of light load at the expense of a slight increase in
the call blocking probability. The effect of reservation duration in the new
scenario is analyzed in Figure 14. As in the case of light load scenario,
longer reservation duration implies lower call dropping probability.
, a slight variation of the light load scenario. It is
apparent from Figure 13 that call dropping probability is significantly
reduced also in the case of light load at the expense of a slight increase in
the call blocking probability. The effect of reservation duration in the new
scenario is analyzed in Figure 14. As in the case of light load scenario,
longer reservation duration implies lower call dropping probability.
In this paper, we propose a novel mobility model for cellular networks. The mobility and call patterns of the subscribers together with their initial distribution are based on a given real map. Our model captures the moving-in-groups, conscious traveling, and inertial behaviors of the subscribers in the real life, and respects the non-pass-through feature of structures like households while preserving the autonomy of the subscribers. CDMA technology has been considered for the air interface, and actual outer cell interference has been propagated instead of the approximations commonly used in the literature. We have compared our model against the well-known way point model and shown that the call dropping and blocking probabilities are affected by the choice of the mobility model significantly. We have shown that the choice of the mobility model has a significant impact on the performance of the mobile systems. The effect on the relative performance becomes more important especially when the algorithms try to predict the mobility of the subscriber.
Since a flat map of only two dimensions is used, bridges running over other roads cannot be specified in the map. Therefore, such bridges are represented as two crossing roads. Thus, the proposed model allows subscribers driving in one road to pass to the other one. However, in the real life, this implies that the subscriber has suddenly jumped on to the bridge. As a future work, the third dimension can be supported for the bridges. We will also apply the proposed mobility model to other schemes, and analyze its effects against the classical schemes.
[1] K. S. Gilhousen, I. M. Jacobs, R. Padovani, A. J. Viterbi, L. A. Weaver Jr., and C. E. Wheatley III, "On the Capacity of a Cellular System," IEEE Transactions on Vehicular Technology, vol. 40, no. 2, pp. 303-312, May 1991.
[2] T. Ozaki, J. B. Kim, and T. Suda, "Bandwidth-Efficient Multicast Routing Protocol for Ad-Hoc Networks," in Proceedings of the 8th IEEE ICCCN Conference, Boston, MA, October 1999, pp. 10-17.
[3] I. F. Akyildiz, Y.-B. Lin, W. R. Lai, and R.-J. Chen, "A New Random Walk Model for PCS Networks," IEEE Journal on Selected Areas in Communications, vol. 18, no. 7, pp. 1254-1260, July 2000.
[4] I. F. Akyildiz, J. S. M. Ho, and Y.-B. Lin, "Movement-Based Location Update and Selective Paging for PCS Network," IEEE/ACM Transactions on Networking, vol. 4, no. 4, pp. 629-638, August 1996.
[5] Y.-B. Lin, W. R. Lai, and R. J. Chen, "Performance Analysis for Dual Band PCS Networks," IEEE Transactions on Computers, vol. 49, no. 2, pp. 148-159, February 2000.
[6] R. A. Guerin, "Channel Occupancy Time Distribution in a Cellular Radio System," IEEE Transactions on Vehicular Technology, vol. 36, no. 3, pp. 89-99, August 1987, 1987.
[7] I. Norros, "On the Use of Fractional Brownian Motion in the Theory of Connectionless Networks," IEEE Journal on Selected Areas in Communications, vol. 13, no. 6, pp. 953-962, August 1995.
[8] Z. Lei and C. Rose, "Wireless Subscriber Mobility Management Using Adaptive Individual Location Areas for PCS Systems," in Proceedings of the IEEE ICC, Atlanta, GA, June 1998.
[9] D. A. Levine, I. F. Akyildiz, and M. Naghshineh, "A Resource Estimation and Call Admission Algorithm for Wireless Multimedia Networks Using The Shadow Cluster Concept," IEEE/ACM Transactions on Networking, vol. 5, no. 1, pp. 1-12, February 1997.
[10] B. Jabbari, A. Nakajima, and J. Kulkarni, "Network Issues for Wireless Communications," IEEE Communications Magazine, vol. 33, no. 1, pp. 88-98, January 1995.
[11] K.-H. Chiang and N. Shenoy, "A Random Walk Mobility Model for Location Management in Wireless Networks," in Proceedings of the 12th IEEE PIMRC Symposium, San Diego, CA, September/October 2001, vol. 2, pp. 43-48.
[12] M. M. Zonoozi and P. Dassanayake, "User Mobility Modeling and Characterization of Mobility Patterns," IEEE Journal on Selected Areas in Communications, vol. 15, no. 7, pp. 1239-1252, September 1997.
[13] O. K. Tonguz, S. Mishra, and R. Josyula, "Intelligent Paging in Wireless Networks: Random Mobility Models and Grouping Algorithms for Locating Subscribers," in Proceedings of the 49th IEEE VTC Conference, Houston, TX, May 1999, vol. 2, pp. 1177-1181.
[14] J. Scourias and T. Kunz, "Activity-based Mobility Modeling: Realistic Evaluation of Location Management Schemes for Cellular Networks," in Proceedings of the IEEE WCNC Conference, New Orleans, September 1999, vol. 1, pp. 296-300.
[15] C. Bettstetter, "Smooth is Better Than Sharp: A Random Mobility Model for Simulation of Wireless Networks," in Proceedings of the 4th ACM International Workshop on Modeling, Analysis, and Simulation of Wireless and Mobile Systems (WSWiM'01), Rome, Italy, July 2001, pp. 19-27.
[16] W. Su, S.-J. Lee, and M. Gerla, "Mobility Prediction in Wireless Networks," in Proceedings of the IEEE MILCOM 2000 Conference, Los Angeles, CA, 2000, vol. 1, pp. 491-495.
[17] E. M. Royer and C. E. Perkins, "Multicast Operation of the Ad-hoc On-demand Distance Vector Routing Protocol," in Proceedings of ACM MobiCom Conference, Seattle, WA, August 1999, pp. 207-218.
[18] S. R. Das, C. E. Perkins, and E. M. Royer, "Performance Comparison of Two On-demand Routing Protocols for Ad Hoc Networks," in Proceedings of the IEEE Infocom Conference, Tel Aviv, Israel, March 2000, pp. 3-12.
[19] M.-H. Yang, L.-W. Chen, Y.-C. Tseng, and J.-P. Sheu, "A Traveling Salesman Mobility Model and Its Location Tracking in PCS Networks," in Proceedings of the 21st IEEE ICDCS Conference, Phoenix, AZ, April 2001, pp. 517-523.
[20] J. G. Markoulidakis, G. L. Lyberopoulos, D. F. Tsirkas, and E. D. Sykas, "Mobility Modeling in Third Generation Mobile Telecommunications Systems," IEEE Personal Communications, vol. 4, no. 4, pp. 41-56, August 1997.
[21] K. K. Leung, W. A. Massey, and W. Whitt, "Traffic Models for Wireless Communications Networks," IEEE Journal on Selected Areas in Communications, vol. 12, no. 8, pp. 1353-1364, October 1999.
[22] S.-J. Lee, W. Su, and M. Gerla, "Wireless Ad Hoc Multicast Routing with Mobility Prediction," Mobile Networks and Applications (MONET), vol. 6, no. 4, pp. 351-360, August 2001.
[23] E. Gelenbe, P. Kammerman, and T. Lam, "Performance Considerations in Totally Mobile Wireless," Performance Evaluation, vol. 36-37, no. 1-4, pp. 387-399, August 1999.
[24] T. S. Kim, J. K. Kwon, and D. K. Sung, "Mobility and Traffic Analysis in Three-dimensinal Highrise Building Environments," IEEE Transactions on Vehicular Technology, vol. 49, no. 5, pp. 1633-1640, May 2000.
[25] ETSI, "Universal mobile telecommunications system (umts); selection procedures for the choice of radio transmission technologies of the umts," Technical Report UMTS 30.03 version 3.2.0, European Telecommunications Standards Institute, April 1998.
[26] T. S. Rappaport, Wireless Communications: Principles and Practice, Prentice Hall, Upper Saddle River, NJ, October 1995.
[27] T. Tugcu and C. Ersoy, "Call Admission based on Interference in DS-CDMA Cellular Systems," in Proceedings of the 4th European Personal Mobile Communications Conference, Vienna, Austria, February 2001.